Centerville: Fire Incidents, Ohio (OH)
Where are fire incidents reported in Centerville, OH
Something went wrong! Please refresh the page.
| Fire incidents reported | |
|---|---|
| Sreet name | Count |
| MAIN ST | 118 |
| ALEX BELL RD | 90 |
| MIAMISBURG CENTERVILLE RD | 56 |
| PIMLICO DR | 44 |
| FAR HILLS AV | 42 |
| FRANKLIN ST | 38 |
| SOCIAL ROW RD | 36 |
| SPRING VALLEY PK | 32 |
| WASHINGTON VILLAGE DR | 30 |
| CLYO RD | 28 |
| YANKEE ST | 28 |
| LYONS RD | 24 |
| CHASE DR | 22 |
| MAIN | 22 |
| LOGANWOOD DR | 20 |
| MAD RIVER RD | 20 |
| DAYTON LEBANON PK | 18 |
| LOOP RD | 18 |
| SHEEHAN RD | 18 |
| WILMINGTON PK | 18 |
| WILMINGTON PK. | 18 |
| ALEX BELL | 16 |
| ALEX-BELL RD | 16 |
| CHEVY LN | 16 |
| FAR HILLS AVE | 16 |
| NORTH VILLAGE DR | 16 |
| WHIPP RD | 16 |
| AMBRIDGE RD | 14 |
| BERYL TRAIL | 14 |
| FAR HILLS | 14 |
| Other | 333 |
2003 - 2018 National Fire Incident Reporting System (NFIRS) incidents
- Incident types reported to NFIRS in Centerville, OH
- 8,99862.1%Rescue & EMS
- 1,72411.9%Hazardous Condition
- 1,2868.9%Service Call
- 1,2118.4%Fire
- 6734.6%False Alarm
- 5613.9%Good Intent Call
- 230.2%Overpressure Rupture
- Fire incident types reported to NFIRS in Centerville, OH
- 57147.2%Structure Fires
- 48740.2%Outside Fires
- 15312.6%Mobile Property/Vehicle Fires
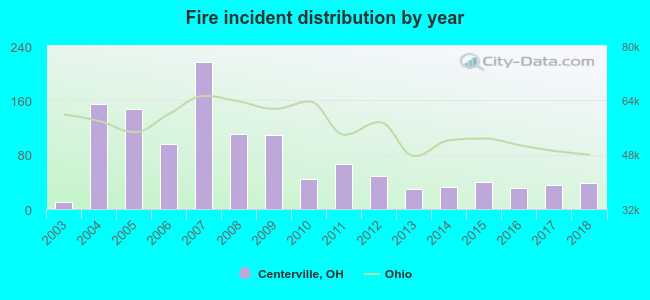 According to the data from the years 2003 - 2018 the average number of fire incidents per year is 75. The highest number of reported fire incidents - 217 took place in 2007, and the least - 10 in 2003. The data has a growing trend.
The average number of yearly fire incidents per 10k residents in Centerville, OH compared to nearest cities:
(Note: Based on data for the last 3 years, including only cities with population 5,000 and above)
| Centerville: | 14.6 |
| Bellbrook: | 10.0 |
| Kettering: | 14.8 |
| Oakwood: | 46.2 |
| West Carrollton City: | 1.2 |
| Moraine: | 108.9 |
| West Carrollton: | 35.8 |
| Springboro: | 20.9 |
| Miamisburg: | 56.7 |
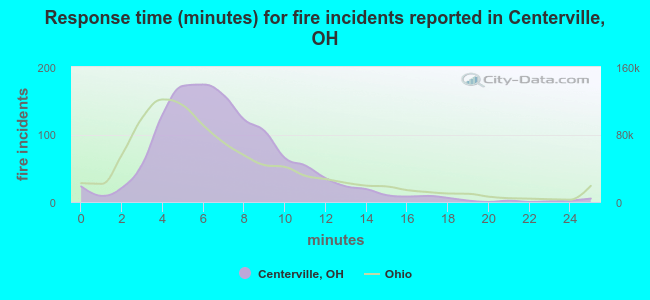 The median response time based on all reported fire incidents is 7 minutes. This is about the same as the Ohio median value.
The median response time in Centerville, OH compared to nearest cities:
(Note: Based on data for all years, including only cities with at least 500 fire incidents)
| Centerville: | 7 minutes |
| Kettering: | 6 minutes |
| Oakwood: | 5 minutes |
| Moraine: | 5 minutes |
| West Carrollton: | 5 minutes |
| Springboro: | 6 minutes |
| Miamisburg: | 6 minutes |
| Beavercreek: | 6 minutes |
| Dayton: | 5 minutes |
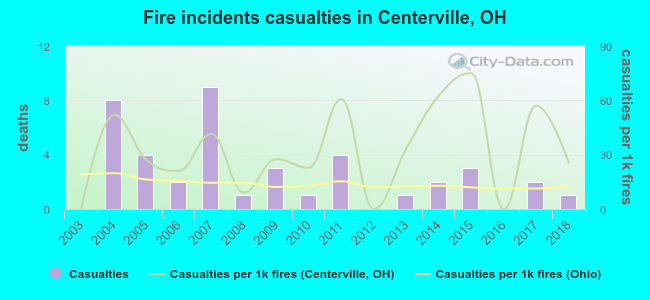 According to the reports from the years 2003 - 2018 the average number of fire-related yearly casualties is 3. The highest number of reported casualties - 9 took place in 2007, and the lowest - 0 in 2003. The data has a growing trend.
The average number of injuries per 1,000 fires is 32. This indicator was the highest - 75 in 2015, and the lowest 0 in 2003. The trend for injuries per 1,000 incidents is rising. Compared to the Ohio value the number of injuries per 1,000 incidents is much higher.
According to the reports from the years 2003 - 2018 the average number of fire-related yearly casualties is 3. The highest number of reported casualties - 9 took place in 2007, and the lowest - 0 in 2003. The data has a growing trend.
The average number of injuries per 1,000 fires is 32. This indicator was the highest - 75 in 2015, and the lowest 0 in 2003. The trend for injuries per 1,000 incidents is rising. Compared to the Ohio value the number of injuries per 1,000 incidents is much higher.Casualties per 1,000 incidents in Centerville, OH compared to nearest cities:
(Note: Based on data for all years, including only cities with at least 500 fire incidents)
| Centerville: | 33.9 |
| Kettering: | 25.7 |
| Oakwood: | 2.1 |
| Moraine: | 20.1 |
| West Carrollton: | 23.9 |
| Springboro: | 11.8 |
| Miamisburg: | 14.3 |
| Beavercreek: | 36.2 |
| Dayton: | 20.5 |
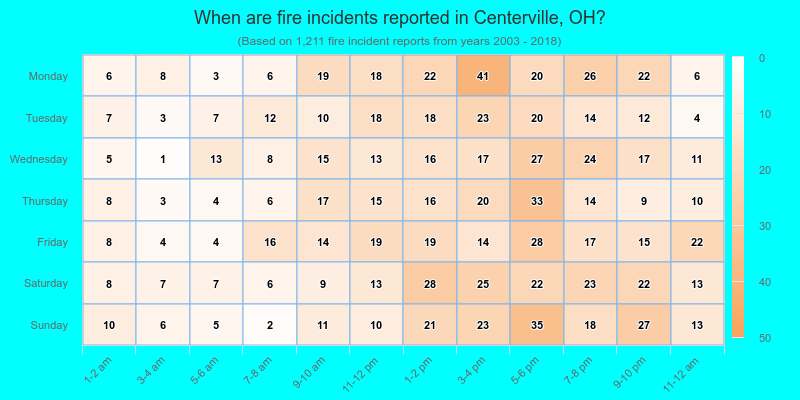
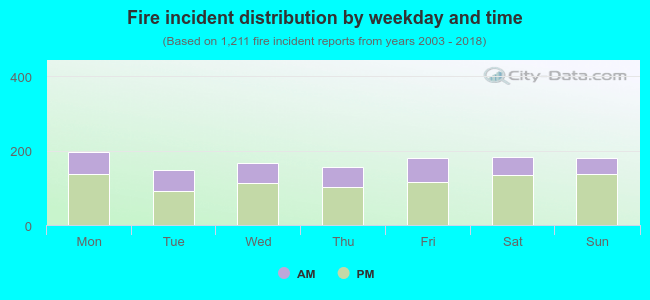 31.7% incidents where reported in the morning and 68.3% in the evening. The most fires (16.3%) took place on Monday, and the least (12.2%) on Tuesday.
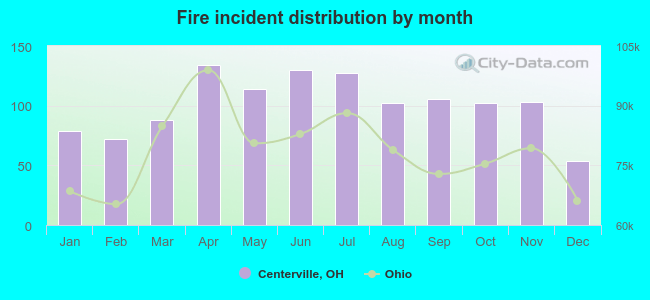 According to the 1,211 incident reports from years 2003 - 2018 most fires (11.1%) took place during April, and the least (4.5%) in December.
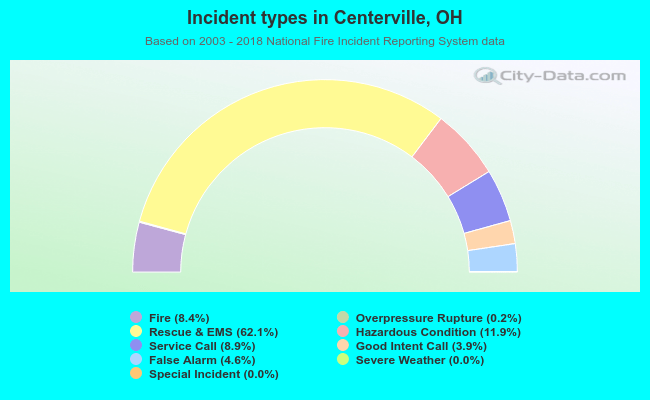 Out of all 14,486 cases reported during the years 2003 - 2018, the most belonged to the categories: Rescue & EMS (62.1%), Hazardous Condition (11.9%), and Service Call (8.9%).
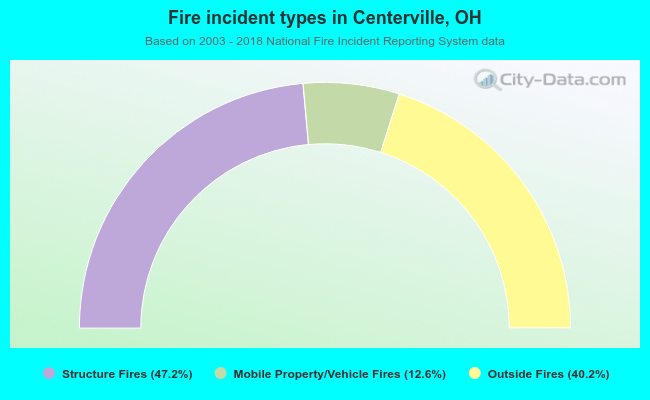 When looking into fire subcategories, the most incidents belonged to: Structure Fires (47.2%), and Outside Fires (40.2%).