Chatsworth: Fire Incidents, Georgia (GA)
Where are fire incidents reported in Chatsworth, GA
Something went wrong! Please refresh the page.
|
| |||||||||||||||||||||||||||||||||||||||||||||||||||||||||||||||||||||||||||||||||||||||||||||||||||||||||||||
| Other | 233 | |||||||||||||||||||||||||||||||||||||||||||||||||||||||||||||||||||||||||||||||||||||||||||||||||||||||||||||
2002 - 2018 National Fire Incident Reporting System (NFIRS) incidents
- Incident types reported to NFIRS in Chatsworth, GA
- 5,22351.6%Rescue & EMS
- 1,46914.5%Fire
- 1,19411.8%Good Intent Call
- 1,16911.6%Hazardous Condition
- 5895.8%False Alarm
- 4034.0%Service Call
- 300.3%Special Incident
- 190.2%Overpressure Rupture
- 180.2%Severe Weather
- Fire incident types reported to NFIRS in Chatsworth, GA
- 70648.1%Outside Fires
- 50634.4%Structure Fires
- 21814.8%Mobile Property/Vehicle Fires
- 392.7%Other
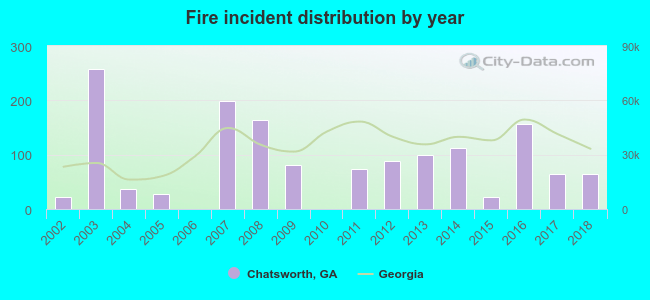 Based on the data from the years 2002 - 2018 the average number of fires per year is 86. The highest number of fire incidents - 257 took place in 2003, and the least - 0 in 2006. The data has a growing trend.
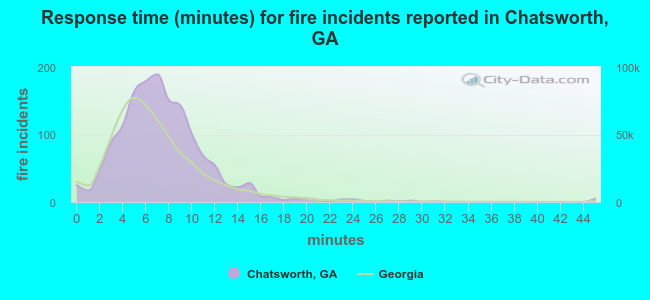 The median response time based on all reported fire incidents is 7 minutes. This is close to the Georgia median value.
The median response time in Chatsworth, GA compared to nearest cities:
(Note: Based on data for all years, including only cities with at least 500 fire incidents)
| Chatsworth: | 7 minutes |
| Dalton: | 5 minutes |
| Ellijay: | 9 minutes |
| Calhoun: | 6 minutes |
| Ringgold: | 9 minutes |
| Rock Spring: | 8 minutes |
| Blue Ridge: | 8 minutes |
| Jasper: | 9 minutes |
| Fort Oglethorpe: | 6 minutes |
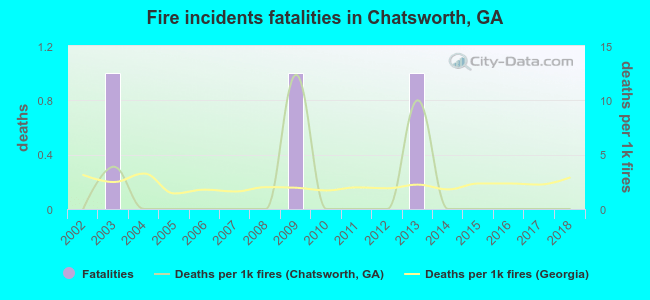 According to the reports from the years 2002 - 2018 the average number of fire-related yearly deaths is 0. The highest number of reported deaths - 1 took place in 2003, and the lowest - 0 in 2002. The data has a constant trend.
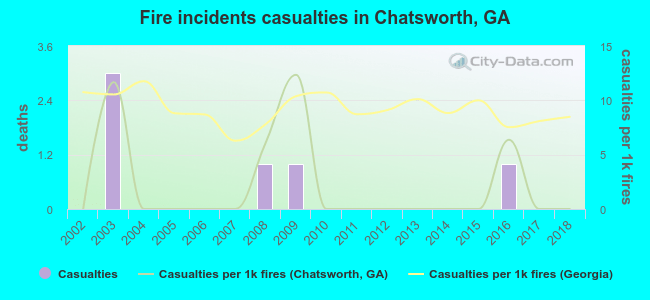 Based on the reports from the years 2002 - 2018 the average number of fire-related yearly casualties is 0. The highest number of injuries - 3 took place in 2003, and the lowest - 0 in 2002. The data has a constant trend.
The average number of casualties per 1,000 fires is 2. This indicator was the highest - 12 in 2009, and the lowest 0 in 2002. The trend for injuries per 1,000 fire incidents is constant. Compared to the state value the number of casualties per 1,000 fires is much lower.
Based on the reports from the years 2002 - 2018 the average number of fire-related yearly casualties is 0. The highest number of injuries - 3 took place in 2003, and the lowest - 0 in 2002. The data has a constant trend.
The average number of casualties per 1,000 fires is 2. This indicator was the highest - 12 in 2009, and the lowest 0 in 2002. The trend for injuries per 1,000 fire incidents is constant. Compared to the state value the number of casualties per 1,000 fires is much lower.Casualties per 1,000 incidents in Chatsworth, GA compared to nearest cities:
(Note: Based on data for all years, including only cities with at least 500 fire incidents)
| Chatsworth: | 4.1 |
| Dalton: | 18.1 |
| Ellijay: | 6.5 |
| Calhoun: | 4.2 |
| Ringgold: | 3.5 |
| Rock Spring: | 11.3 |
| Blue Ridge: | 2.1 |
| Jasper: | 8.8 |
| Fort Oglethorpe: | 15.2 |
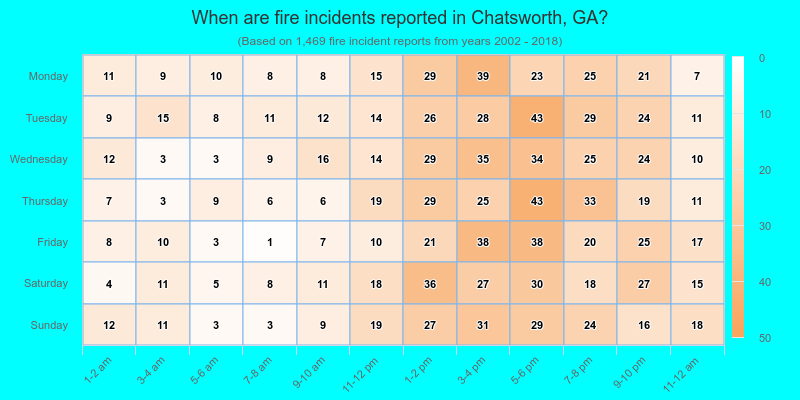
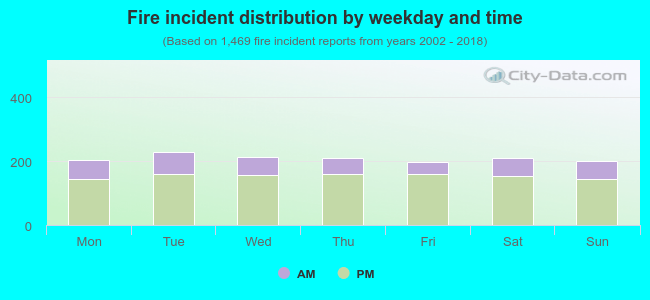 26.5% incidents where reported in the morning and 73.5% in the evening. The most fires (15.7%) took place on Tuesday, and the least (13.5%) on Friday.
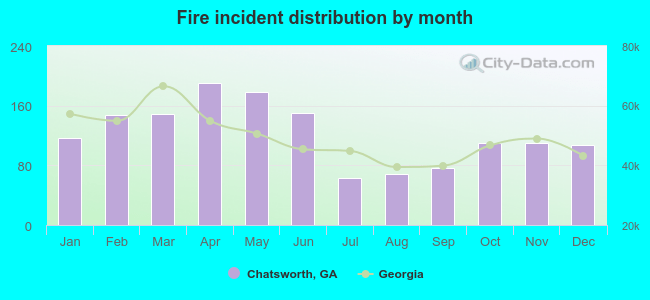 Based on the 1,469 reports from years 2002 - 2018 most fires (13.0%) took place during April, and the least (4.3%) in July.
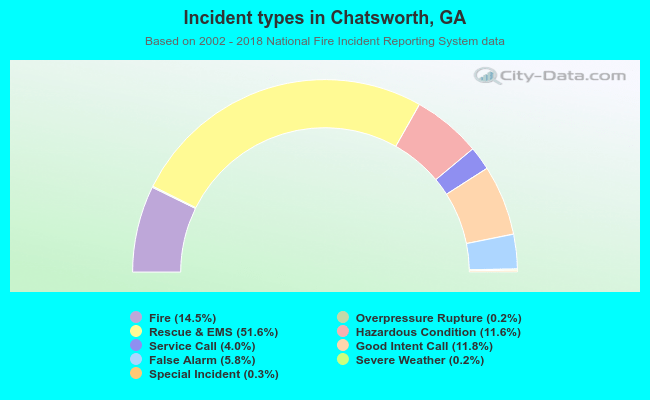 Out of all 10,114 cases reported during the years 2002 - 2018, the most belonged to the categories: Rescue & EMS (51.6%), Fire (14.5%), and Good Intent Call (11.8%).
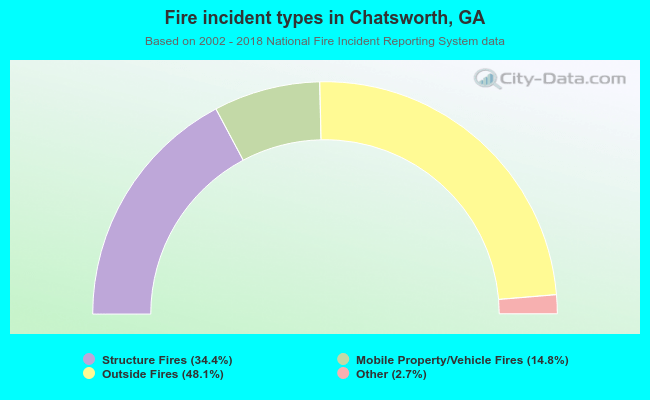 When looking into fire subcategories, the most incidents belonged to: Outside Fires (48.1%), and Structure Fires (34.4%).