Chehalis: Fire Incidents, Washington (WA)
Where are fire incidents reported in Chehalis, WA
Something went wrong! Please refresh the page.
| Fire incidents reported | |
|---|---|
| Sreet name | Count |
| JACKSON HWY | 124 |
| LOUISIANA AVE | 120 |
| BISHOP RD | 106 |
| NATIONAL AVE | 84 |
| MARKET BLVD | 80 |
| MAURIN RD | 80 |
| LOGAN HILL RD | 78 |
| BUNKER CREEK RD | 68 |
| NW LOUISIANA | 68 |
| CHEHALIS AVE | 66 |
| WASHINGTON AVE | 66 |
| BROCKWAY RD | 56 |
| STATE ROUTE 508 | 50 |
| STATE ROUTE 6 | 50 |
| INTERSTATE AVE | 48 |
| RIBELIN RD | 46 |
| S MARKET | 44 |
| KOONTZ RD | 42 |
| N NATIONAL | 40 |
| 603 HWY | 36 |
| CENTRALIA ALPHA RD | 36 |
| N MARKET | 36 |
| SALSBURY AVE | 36 |
| CHILVERS RD | 34 |
| FORK RD | 34 |
| MAIN ST | 34 |
| PLEASANT VALLEY RD | 34 |
| 3RD ST | 32 |
| RICE RD | 32 |
| BROWN RD | 30 |
| Other | 1,059 |
2002 - 2018 National Fire Incident Reporting System (NFIRS) incidents
- Incident types reported to NFIRS in Chehalis, WA
- 9,80361.8%Rescue & EMS
- 2,74917.3%Fire
- 1,3688.6%Good Intent Call
- 8805.5%False Alarm
- 5303.3%Service Call
- 4672.9%Hazardous Condition
- 380.2%Special Incident
- 250.2%Overpressure Rupture
- Fire incident types reported to NFIRS in Chehalis, WA
- 1,06838.9%Structure Fires
- 80129.1%Outside Fires
- 47417.2%Other
- 40614.8%Mobile Property/Vehicle Fires
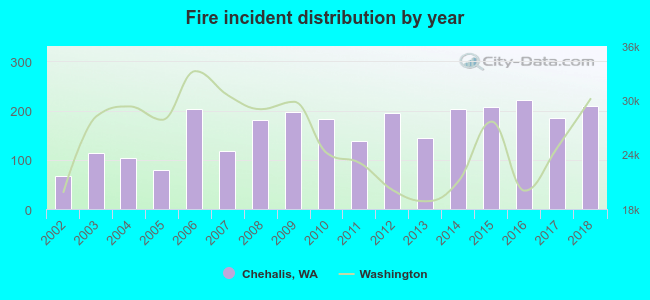 According to the data from the years 2002 - 2018 the average number of fire incidents per year is 162. The highest number of fire incidents - 221 took place in 2016, and the least - 68 in 2002. The data has a rising trend.
The average number of yearly fire incidents per 10k residents in Chehalis, WA compared to nearest cities:
(Note: Based on data for the last 3 years, including only cities with population 5,000 and above)
| Chehalis: | 282.8 |
| Centralia: | 104.3 |
| Tumwater: | 58.6 |
| Yelm: | 167.0 |
| Lacey: | 35.4 |
| Olympia: | 118.4 |
| DuPont: | 2.9 |
| Rose Valley: | 4.0 |
| Longview: | 67.3 |
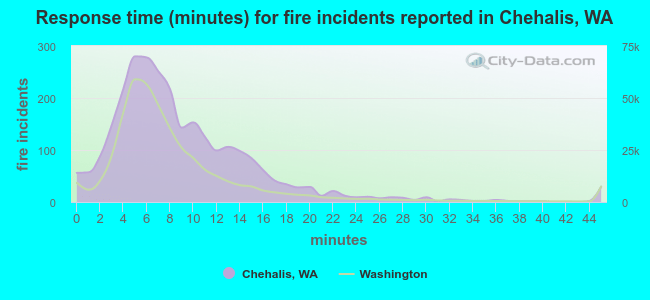 The median response time based on all reported fire incidents is 7 minutes. This is close to the state median value.
The median response time in Chehalis, WA compared to nearest cities:
(Note: Based on data for all years, including only cities with at least 500 fire incidents)
| Chehalis: | 7 minutes |
| Centralia: | 6 minutes |
| Winlock: | 11 minutes |
| Rochester: | 9 minutes |
| Tenino: | 10 minutes |
| Toledo: | 11 minutes |
| Tumwater: | 7 minutes |
| Yelm: | 10 minutes |
| Lacey: | 6 minutes |
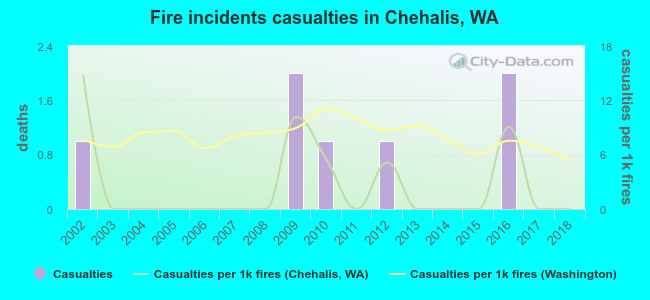 Based on the data from the years 2002 - 2018 the average number of fire-related yearly casualties is 0. The highest number of reported injuries - 2 took place in 2009, and the lowest - 0 in 2003. The data has a dropping trend.
The average number of injuries per 1,000 fires is 3. This indicator was the highest - 15 in 2002, and the lowest 0 in 2003. The trend for casualties per 1,000 incidents is dropping. Compared to the Washington value the number of injuries per 1,000 incidents is much lower.
Based on the data from the years 2002 - 2018 the average number of fire-related yearly casualties is 0. The highest number of reported injuries - 2 took place in 2009, and the lowest - 0 in 2003. The data has a dropping trend.
The average number of injuries per 1,000 fires is 3. This indicator was the highest - 15 in 2002, and the lowest 0 in 2003. The trend for casualties per 1,000 incidents is dropping. Compared to the Washington value the number of injuries per 1,000 incidents is much lower.
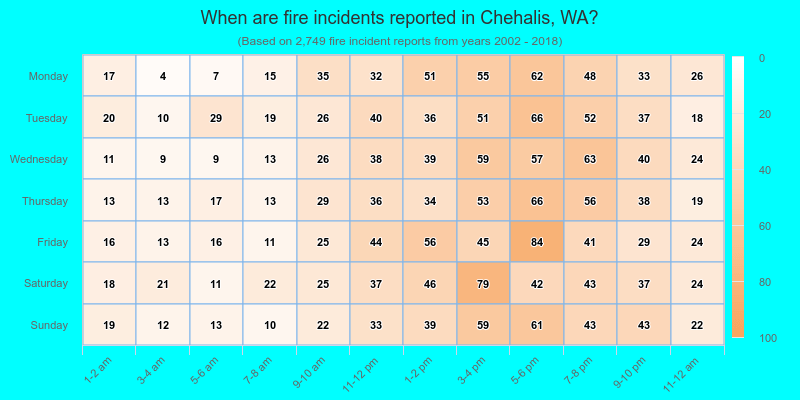
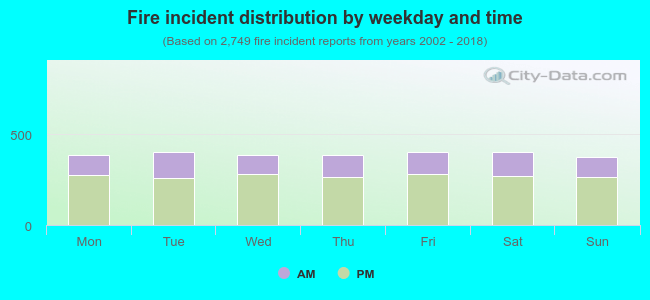 30.9% incidents where reported in the morning and 69.1% in the evening. The most fires (14.7%) took place on Saturday, and the least (13.7%) on Sunday.
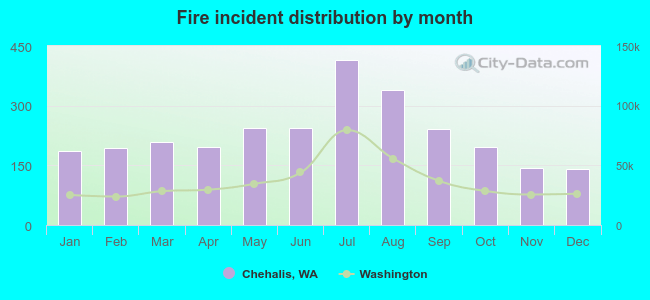 Based on the 2,749 fires from years 2002 - 2018 most fires (15.1%) took place during July, and the least (5.1%) in December.
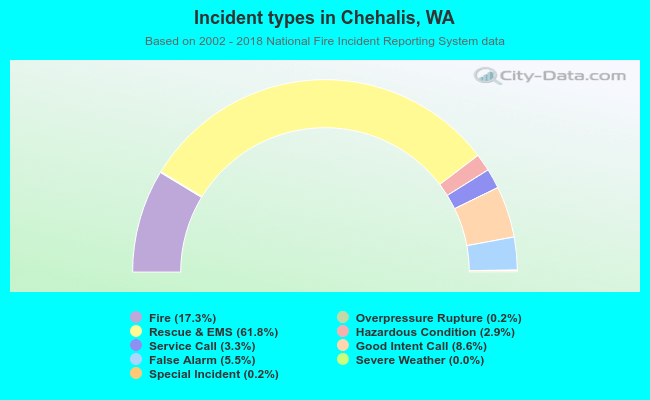 Out of all 15,866 cases reported during the years 2002 - 2018, the most belonged to the categories: Rescue & EMS (61.8%), Fire (17.3%), and Good Intent Call (8.6%).
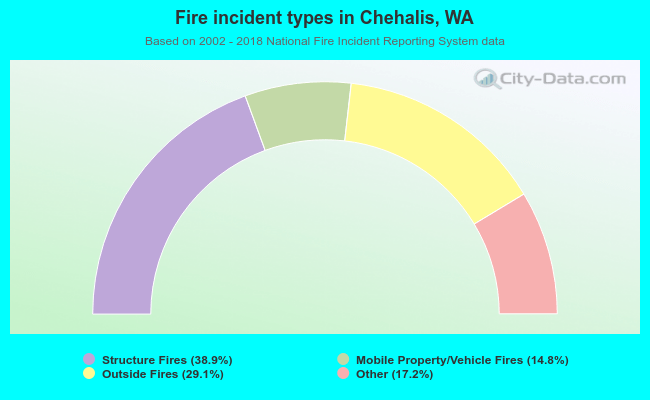 When looking into fire subcategories, the most incidents belonged to: Structure Fires (38.9%), and Outside Fires (29.1%).