Chenoa: Fire Incidents, Illinois (IL)
Where are fire incidents reported in Chenoa, IL
Something went wrong! Please refresh the page.
|
| |||||||||||||||||||||||||||||||||||||||||||||||||||||||||||||||||||||||||||||||||||||||||||||||||||||||||||||
2002 - 2018 National Fire Incident Reporting System (NFIRS) incidents
- Incident types reported to NFIRS in Chenoa, IL
- 22142.1%Fire
- 10720.4%Good Intent Call
- 10520.0%Hazardous Condition
- 5410.3%Rescue & EMS
- 265.0%False Alarm
- 101.9%Service Call
- 20.4%Special Incident
- Fire incident types reported to NFIRS in Chenoa, IL
- 10447.1%Structure Fires
- 7634.4%Outside Fires
- 3214.5%Mobile Property/Vehicle Fires
- 94.1%Other
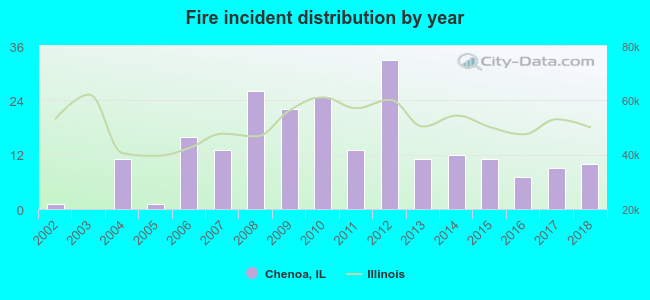 According to the data from the years 2002 - 2018 the average number of fire incidents per year is 13. The highest number of fire incidents - 33 took place in 2012, and the least - 0 in 2003. The data has a rising trend.
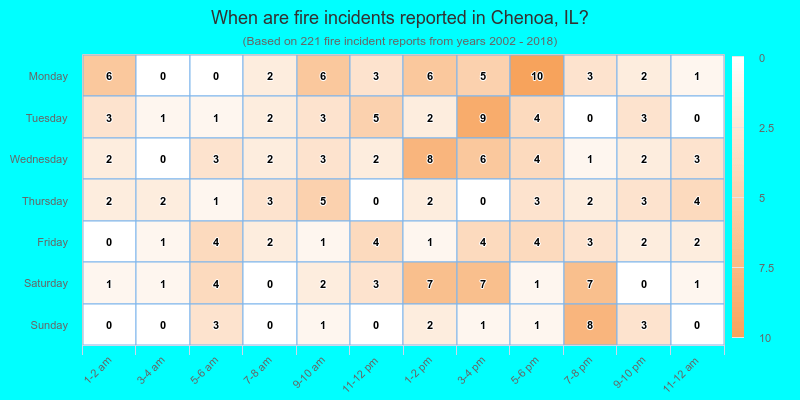
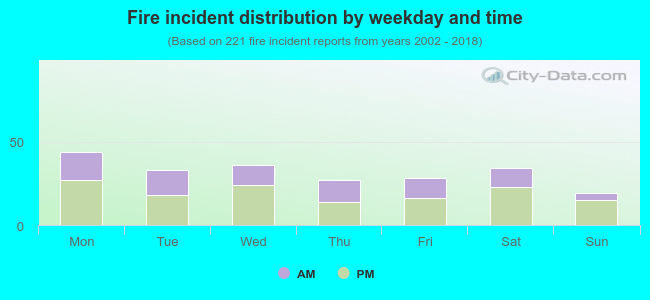 38.0% incidents where reported in the morning and 62.0% in the evening. The most fires (19.9%) took place on Monday, and the least (8.6%) on Sunday.
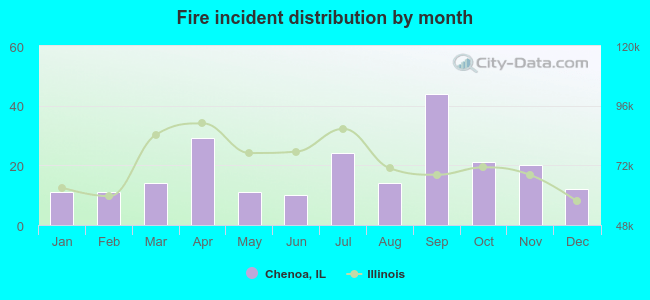 According to the 221 fires from years 2002 - 2018 most fires (19.9%) took place during September, and the least (4.5%) in June.
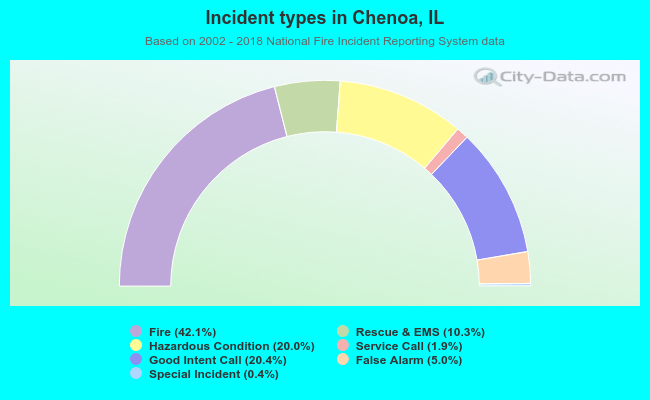 Out of all 525 cases reported during the years 2002 - 2018, the most belonged to the categories: Fire (42.1%), Service Call (20.4%), and Rescue & EMS (20.0%).
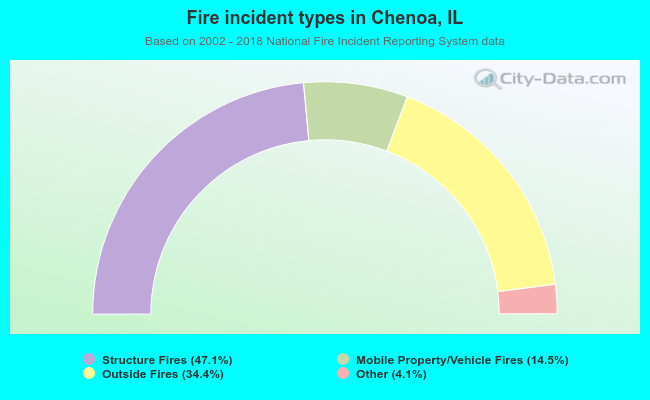 When looking into fire subcategories, the most reports belonged to: Structure Fires (47.1%), and Outside Fires (34.4%).