Cheshire: Fire Incidents, Connecticut (CT)
Where are fire incidents reported in Cheshire, CT
Something went wrong! Please refresh the page.
| Fire incidents reported | |
|---|---|
| Sreet name | Count |
| SOUTH MAIN ST | 98 |
| WATERBURY RD | 78 |
| HIGHLAND AVE. | 76 |
| I-84 WEST, EXITS 26-27 | 62 |
| MAIN ST | 62 |
| HIGHLAND AVE | 50 |
| PECK LA | 40 |
| 84 | 36 |
| WEST MAIN ST | 34 |
| EAST MITCHELL AVE | 30 |
| MAIN ST | 30 |
| MARION RD | 30 |
| MIXVILLE RD | 26 |
| WALLINGFORD RD | 26 |
| I-84 EAST , EXITS 26-27 | 24 |
| INTERSTATE 691 WESTBOUND | 24 |
| OAK AVE | 22 |
| RESERVOIR RD | 22 |
| CORNWALL AV | 20 |
| INTERSTATE 691 EASTBOUND | 20 |
| JARVIS ST | 20 |
| MAPLE AVE | 20 |
| CHESHIRE ST | 18 |
| EAST JOHNSON AV | 18 |
| NORTH BROOKSVALE RD | 18 |
| PATTON DR | 18 |
| PROSPECT RD | 18 |
| BYAM RD | 16 |
| COOK HILL RD | 16 |
| JOHNSON AVE | 16 |
| Other | 379 |
2002 - 2018 National Fire Incident Reporting System (NFIRS) incidents
- Incident types reported to NFIRS in Cheshire, CT
- 3,66943.4%Hazardous Condition
- 1,90922.6%False Alarm
- 1,36716.2%Fire
- 6677.9%Good Intent Call
- 6017.1%Service Call
- 2022.4%Rescue & EMS
- 240.3%Overpressure Rupture
- 90.1%Severe Weather
- Fire incident types reported to NFIRS in Cheshire, CT
- 69150.5%Structure Fires
- 39228.7%Outside Fires
- 27820.3%Mobile Property/Vehicle Fires
- 60.4%Other
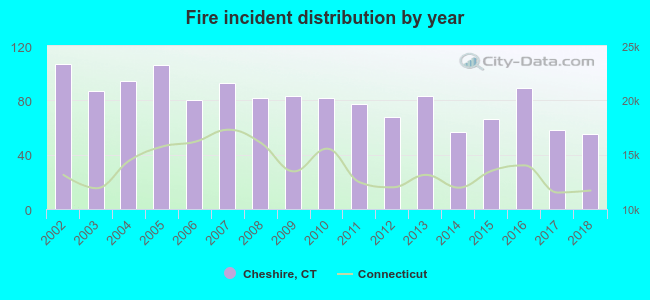 According to the data from the years 2002 - 2018 the average number of fire incidents per year is 80. The highest number of reported fire incidents - 107 took place in 2002, and the least - 55 in 2018. The data has a decreasing trend.
The average number of yearly fire incidents per 10k residents in Cheshire, CT compared to nearest cities:
(Note: Based on data for the last 3 years, including only cities with population 5,000 and above)
| Cheshire: | 23.0 |
| Prospect: | 14.9 |
| Wallingford: | 27.8 |
| Meriden: | 36.2 |
| Southington: | 21.6 |
| Wolcott: | 22.2 |
| Naugatuck: | 31.4 |
| Waterbury: | 51.4 |
| Bethany: | 11.4 |
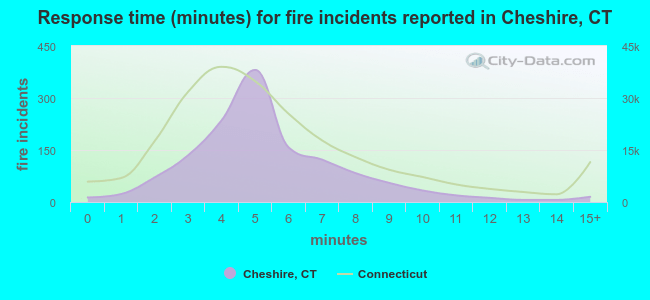 The median response time based on all reported fire incidents is 5 minutes. This is about the same as the Connecticut median value.
The median response time in Cheshire, CT compared to nearest cities:
(Note: Based on data for all years, including only cities with at least 500 fire incidents)
| Cheshire: | 5 minutes |
| Wallingford: | 6 minutes |
| Meriden: | 4 minutes |
| Southington: | 6 minutes |
| Wolcott: | 5 minutes |
| Naugatuck: | 4 minutes |
| Waterbury: | 4 minutes |
| North Haven: | 6 minutes |
| Hamden: | 4 minutes |
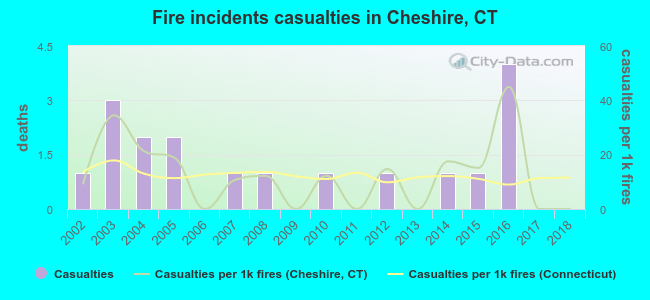 Based on the reports from the years 2002 - 2018 the average number of fire-related yearly casualties is 1. The highest number of injuries - 4 took place in 2016, and the lowest - 0 in 2006. The data has a declining trend.
The average number of casualties per 1,000 fire incidents is 12. This indicator was the highest - 45 in 2016, and the lowest 0 in 2006. The trend for injuries per 1,000 fire incidents is declining. Compared to the state value the number of injuries per 1,000 fire incidents is similar.
Based on the reports from the years 2002 - 2018 the average number of fire-related yearly casualties is 1. The highest number of injuries - 4 took place in 2016, and the lowest - 0 in 2006. The data has a declining trend.
The average number of casualties per 1,000 fire incidents is 12. This indicator was the highest - 45 in 2016, and the lowest 0 in 2006. The trend for injuries per 1,000 fire incidents is declining. Compared to the state value the number of injuries per 1,000 fire incidents is similar.Casualties per 1,000 incidents in Cheshire, CT compared to nearest cities:
(Note: Based on data for all years, including only cities with at least 500 fire incidents)
| Cheshire: | 13.2 |
| Wallingford: | 14.4 |
| Meriden: | 12.3 |
| Southington: | 23.5 |
| Wolcott: | 5.0 |
| Naugatuck: | 17.2 |
| Waterbury: | 13.0 |
| North Haven: | 14.9 |
| Hamden: | 15.1 |
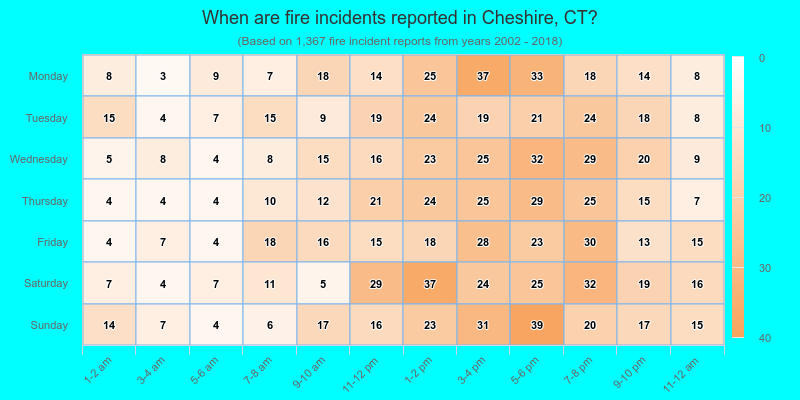
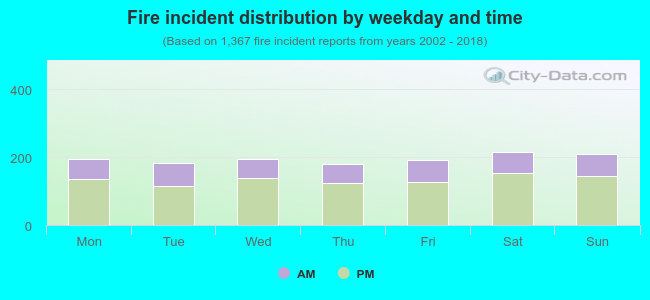 31.5% incidents where reported in the morning and 68.5% in the evening. The most fires (15.8%) took place on Saturday, and the least (13.2%) on Thursday.
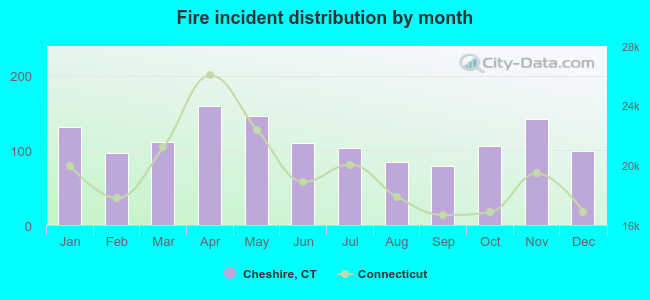 According to the 1,367 fires from years 2002 - 2018 most fires (11.7%) took place during April, and the least (5.8%) in September.
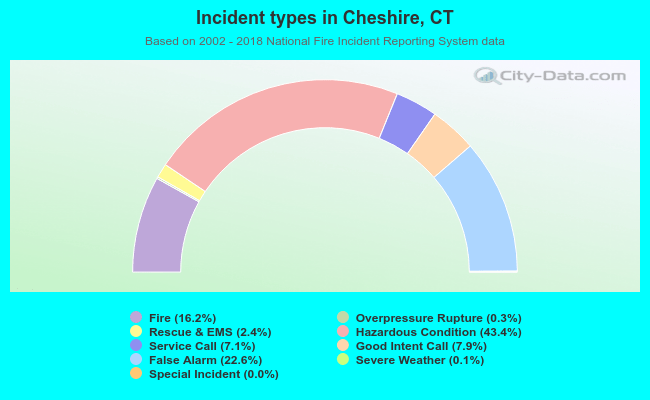 Out of all 8,449 cases reported during the years 2002 - 2018, the most belonged to the categories: Hazardous Condition (43.4%), False Alarm (22.6%), and Fire (16.2%).
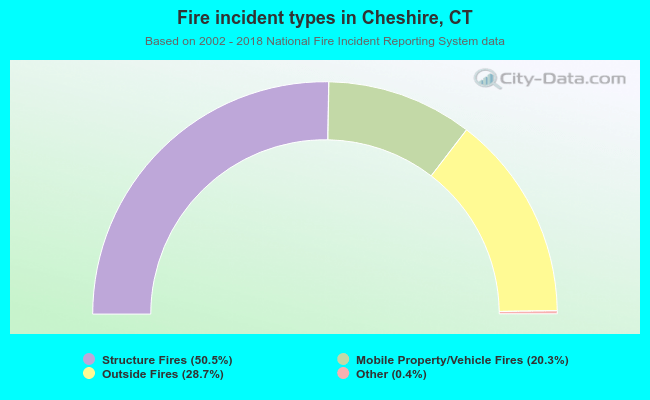 When looking into fire subcategories, the most incidents belonged to: Structure Fires (50.5%), and Outside Fires (28.7%).