Clay City: Fire Incidents, Indiana (IN)
Where are fire incidents reported in Clay City, IN
Something went wrong! Please refresh the page.
|
| |||||||||||||||||||||||||||||||||||||||||||||||||||||||||||||||||||||||||||||||||||||||||||||||||||||||||||||
| Other | 103 | |||||||||||||||||||||||||||||||||||||||||||||||||||||||||||||||||||||||||||||||||||||||||||||||||||||||||||||
2002 - 2018 National Fire Incident Reporting System (NFIRS) incidents
- Incident types reported to NFIRS in Clay City, IN
- 29946.5%Fire
- 23536.5%Rescue & EMS
- 528.1%Hazardous Condition
- 172.6%Good Intent Call
- 152.3%Service Call
- 101.6%Special Incident
- 81.2%False Alarm
- 71.1%Severe Weather
- Fire incident types reported to NFIRS in Clay City, IN
- 13043.5%Structure Fires
- 12642.1%Outside Fires
- 3210.7%Mobile Property/Vehicle Fires
- 113.7%Other
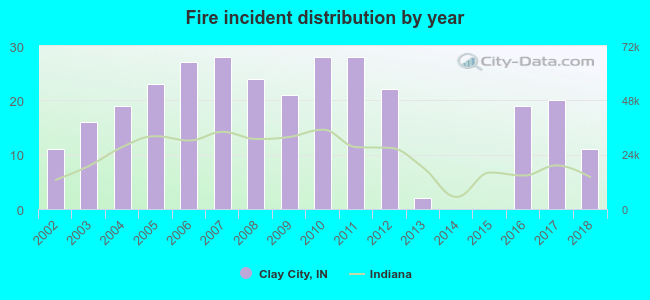 Based on the data from the years 2002 - 2018 the average number of fire incidents per year is 18. The highest number of reported fires - 28 took place in 2007, and the least - 0 in 2014. The data has a constant trend.
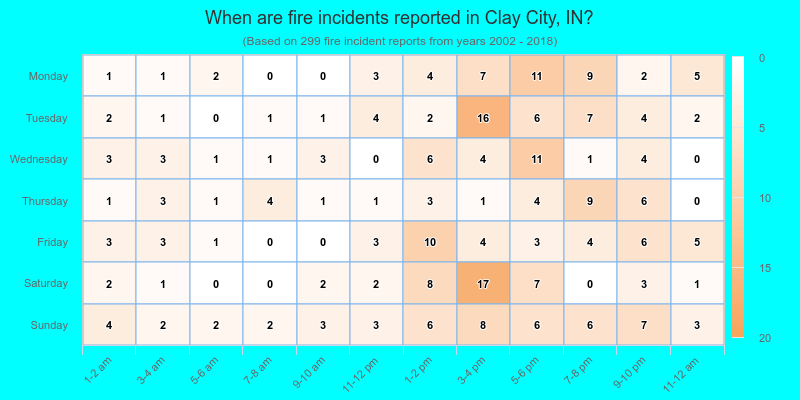
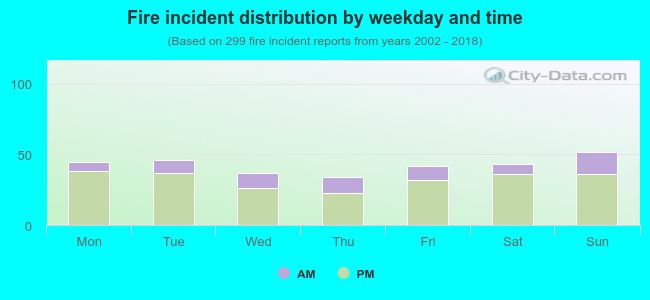 23.7% incidents where reported in the morning and 76.3% in the evening. The most fires (17.4%) took place on Sunday, and the least (11.4%) on Thursday.
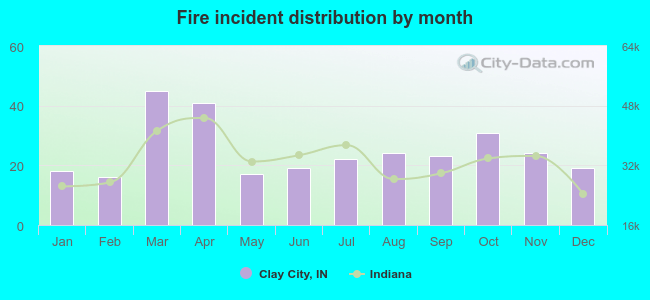 According to the 299 incident reports from years 2002 - 2018 most fires (15.1%) took place during March, and the least (5.4%) in February.
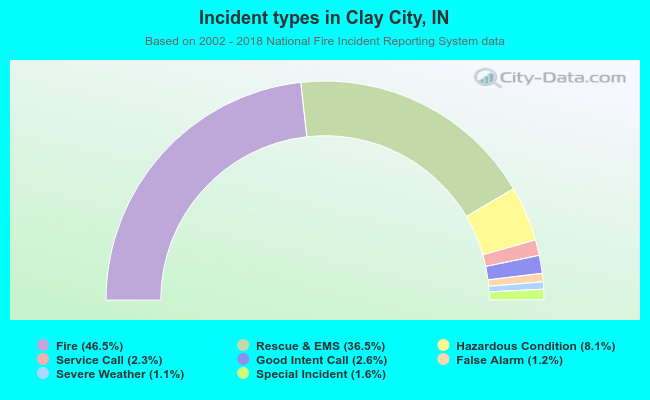 Out of all 643 cases reported during the years 2002 - 2018, the most belonged to the categories: Fire (46.5%), Overpressure Rupture (36.5%), and Rescue & EMS (8.1%).
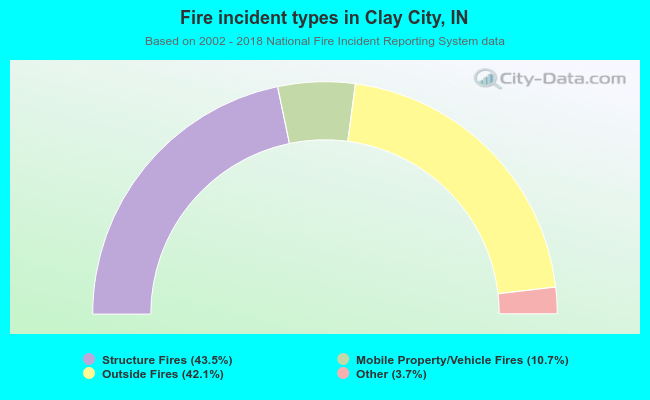 When looking into fire subcategories, the most reports belonged to: Structure Fires (43.5%), and Outside Fires (42.1%).