Clayton: Fire Incidents, Missouri (MO)
Where are fire incidents reported in Clayton, MO
Something went wrong! Please refresh the page.
| Fire incidents reported | |
|---|---|
| Sreet name | Count |
| WYDOWN BLVD | 204 |
| CENTRAL AVE | 140 |
| BRENTWOOD BLVD | 126 |
| BROOKINGS DR | 78 |
| HANLEY RD | 76 |
| FORSYTH BLVD | 66 |
| BONHOMME AVE | 64 |
| CLAYTON RD | 64 |
| RED | 60 |
| PURPLE | 54 |
| CARONDELET PLZ | 46 |
| MERAMEC AVE | 42 |
| MARYLAND AVE | 40 |
| BEMISTON AVE | 36 |
| BUCKINGHAM DR | 34 |
| CARONDELET AVE | 34 |
| WESTWOOD DR | 26 |
| YORK DR | 24 |
| ABERDEEN PL | 22 |
| ALAMO AVE | 22 |
| CORPORATE PARK DR | 22 |
| FRANCIS PL | 22 |
| OXFORD DR | 22 |
| CENTRAL | 18 |
| ROSEBURY AVE | 18 |
| SAN BONITA AVE | 18 |
| INTERSTATE 170 | 16 |
| BROOKINGS | 14 |
| DEMUN AVE | 14 |
| ELLENWOOD AVE | 14 |
2002 - 2018 National Fire Incident Reporting System (NFIRS) incidents
- Incident types reported to NFIRS in Clayton, MO
- 7,93746.1%Rescue & EMS
- 3,14818.3%False Alarm
- 2,89616.8%Good Intent Call
- 1,4548.5%Hazardous Condition
- 1,1726.8%Fire
- 4482.6%Service Call
- 980.6%Overpressure Rupture
- 380.2%Special Incident
- Fire incident types reported to NFIRS in Clayton, MO
- 70660.2%Structure Fires
- 18916.1%Outside Fires
- 16113.7%Other
- 1169.9%Mobile Property/Vehicle Fires
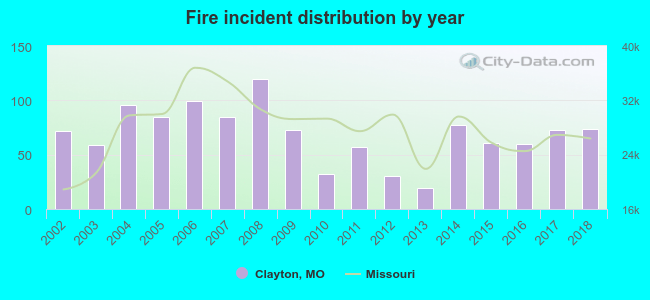 According to the data from the years 2002 - 2018 the average number of fire incidents per year is 69. The highest number of fire incidents - 120 took place in 2008, and the least - 19 in 2013. The data has an increasing trend.
The average number of yearly fire incidents per 10k residents in Clayton, MO compared to nearest cities:
(Note: Based on data for the last 3 years, including only cities with population 5,000 and above)
| Clayton: | 43.4 |
| Richmond Heights: | 78.9 |
| University City: | 47.4 |
| Brentwood: | 51.4 |
| Maplewood: | 75.0 |
| Ladue: | 48.2 |
| Olivette: | 45.9 |
| Shrewsbury: | 28.5 |
| Webster Groves: | 24.9 |
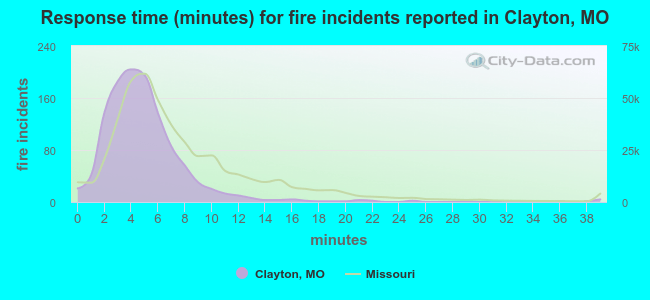 The median response time based on all reported fire incidents is 4 minutes. This is lower compared to the state median value.
The median response time in Clayton, MO compared to nearest cities:
(Note: Based on data for all years, including only cities with at least 500 fire incidents)
| Clayton: | 4 minutes |
| Richmond Heights: | 5 minutes |
| University City: | 5 minutes |
| Brentwood: | 4 minutes |
| Maplewood: | 4 minutes |
| Ladue: | 6 minutes |
| Olivette: | 5 minutes |
| Shrewsbury: | 5 minutes |
| Webster Groves: | 5 minutes |
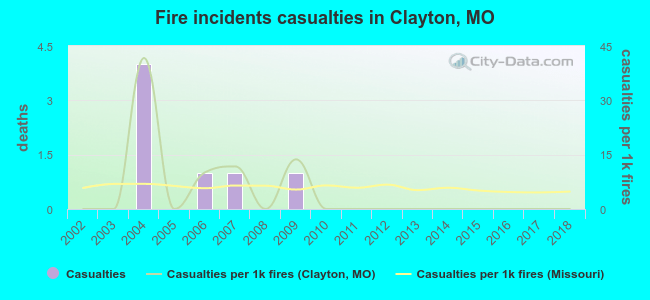 Based on the data from the years 2002 - 2018 the average number of fire-related yearly casualties is 0. The highest number of reported casualties - 4 took place in 2004, and the lowest - 0 in 2002. The data has a constant trend.
The average number of casualties per 1,000 fires is 5. This indicator was the highest - 42 in 2004, and the lowest 0 in 2002. The trend for casualties per 1,000 incidents is decreasing. Compared to the state value the number of injuries per 1,000 incidents is about the same.
Based on the data from the years 2002 - 2018 the average number of fire-related yearly casualties is 0. The highest number of reported casualties - 4 took place in 2004, and the lowest - 0 in 2002. The data has a constant trend.
The average number of casualties per 1,000 fires is 5. This indicator was the highest - 42 in 2004, and the lowest 0 in 2002. The trend for casualties per 1,000 incidents is decreasing. Compared to the state value the number of injuries per 1,000 incidents is about the same.Casualties per 1,000 incidents in Clayton, MO compared to nearest cities:
(Note: Based on data for all years, including only cities with at least 500 fire incidents)
| Clayton: | 6.0 |
| Richmond Heights: | 1.9 |
| University City: | 5.5 |
| Brentwood: | 1.4 |
| Maplewood: | 13.3 |
| Ladue: | 1.7 |
| Olivette: | 5.4 |
| Shrewsbury: | 5.7 |
| Webster Groves: | 1.2 |
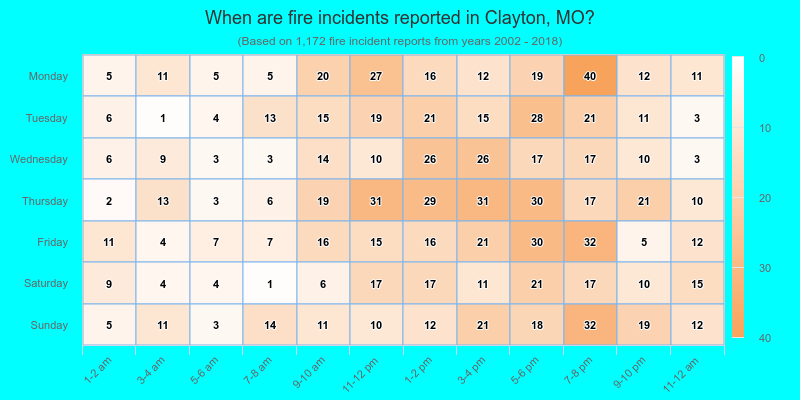
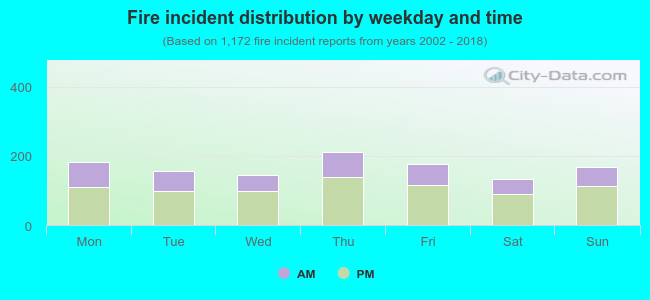 34.6% incidents where reported in the morning and 65.4% in the evening. The most fires (18.1%) took place on Thursday, and the least (11.3%) on Saturday.
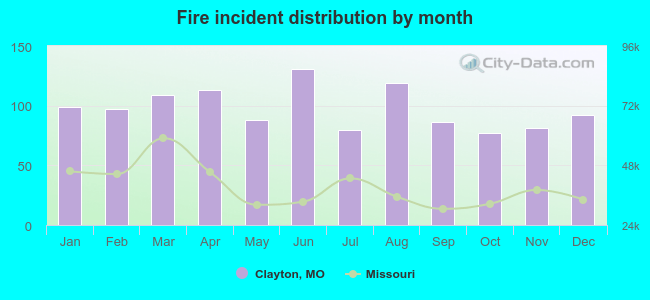 Based on the 1,172 fire incidents from years 2002 - 2018 most fires (11.2%) took place during June, and the least (6.6%) in October.
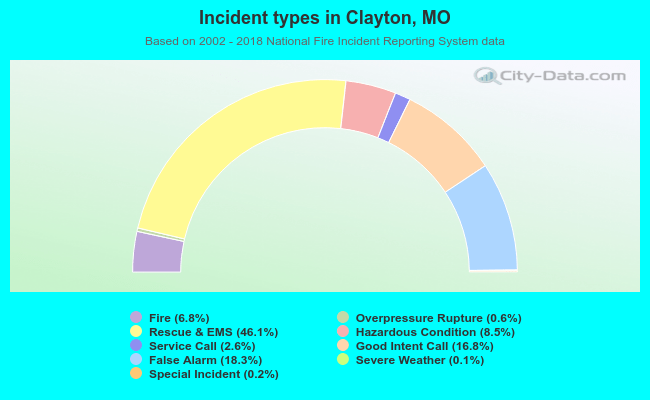 Out of all 17,207 cases reported during the years 2002 - 2018, the most belonged to the categories: Rescue & EMS (46.1%), False Alarm (18.3%), and Good Intent Call (16.8%).
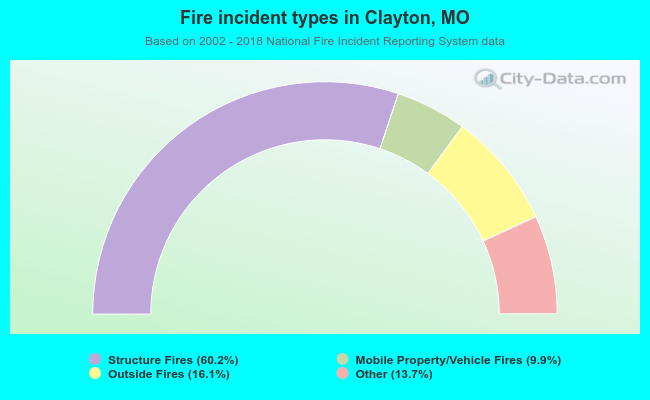 When looking into fire subcategories, the most reports belonged to: Structure Fires (60.2%), and Outside Fires (16.1%).