Cleveland: Fire Incidents, Ohio (OH)
Where are fire incidents reported in Cleveland, OH
Something went wrong! Please refresh the page.
| Fire incidents reported | |
|---|---|
| Sreet name | Count |
| RIVERSIDE DR | 280 |
| EUCLID AV | 82 |
| 55TH ST | 72 |
| 79 ST | 68 |
| 55 ST | 66 |
| LORAIN AVE | 66 |
| 93 ST | 60 |
| 116 ST | 54 |
| 65TH ST | 54 |
| KINSMAN RD | 50 |
| 73 ST | 48 |
| 140TH ST | 46 |
| 71 ST | 46 |
| EUCLID AVE | 46 |
| ST CLAIR AV | 46 |
| 48TH ST | 44 |
| SUPERIOR AVE | 44 |
| 105 ST | 42 |
| 61 ST | 42 |
| 66 ST | 40 |
| DETROIT AVE | 40 |
| LORAIN AV | 40 |
| 130TH ST | 38 |
| 140 ST | 38 |
| 25TH ST | 38 |
| 48 ST | 38 |
| 93RD ST | 38 |
| FULTON RD | 38 |
| INTERSTATE 90 | 38 |
| LEE RD | 38 |
| Other | 4,322 |
2005 - 2018 National Fire Incident Reporting System (NFIRS) incidents
- Incident types reported to NFIRS in Cleveland, OH
- 16,11744.0%Rescue & EMS
- 6,00216.4%Fire
- 5,33214.5%Good Intent Call
- 4,19711.5%Service Call
- 2,8057.7%Hazardous Condition
- 2,0515.6%False Alarm
- 860.2%Overpressure Rupture
- 550.2%Special Incident
- Fire incident types reported to NFIRS in Cleveland, OH
- 3,21653.6%Structure Fires
- 1,64827.5%Outside Fires
- 1,13518.9%Mobile Property/Vehicle Fires
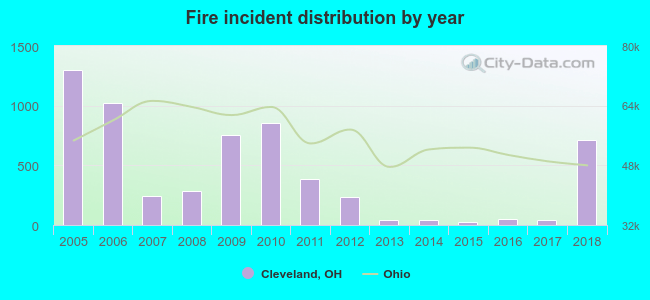 Based on the data from the years 2005 - 2018 the average number of fire incidents per year is 428. The highest number of fires - 1,297 took place in 2005, and the least - 23 in 2015. The data has a decreasing trend.
The average number of yearly fire incidents per 10k residents in Cleveland, OH compared to nearest cities:
(Note: Based on data for the last 3 years, including only cities with population 5,000 and above)
| Cleveland: | 6.9 |
| Brooklyn: | 42.3 |
| Garfield Heights: | 32.2 |
| East Cleveland: | 85.7 |
| Cleveland Heights: | 40.4 |
| Shaker Heights: | 34.3 |
| Seven Hills: | 23.6 |
| Lakewood: | 27.4 |
| University Heights: | 50.2 |
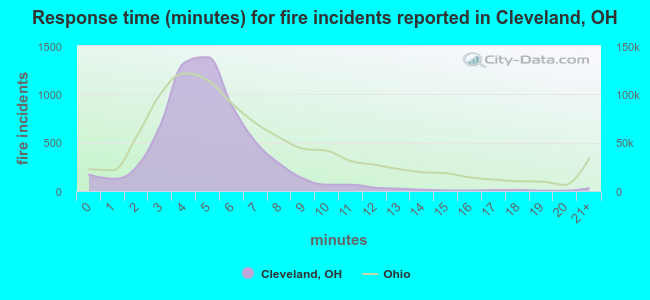 The median response time based on all reported fire incidents is 5 minutes. This is lower compared to the state median value.
The median response time in Cleveland, OH compared to nearest cities:
(Note: Based on data for all years, including only cities with at least 500 fire incidents)
| Cleveland: | 5 minutes |
| Brooklyn: | 4 minutes |
| Garfield Heights: | 4 minutes |
| East Cleveland: | 3 minutes |
| Cleveland Heights: | 5 minutes |
| Shaker Heights: | 4 minutes |
| Lakewood: | 4 minutes |
| University Heights: | 5 minutes |
| Parma: | 4 minutes |
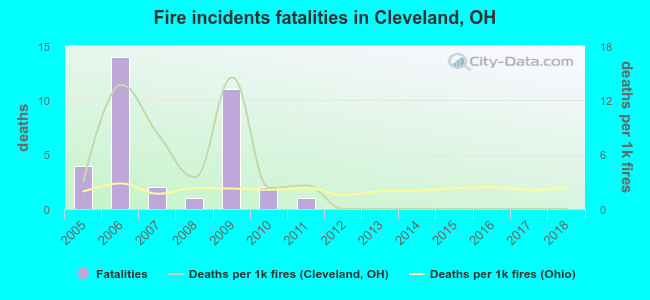 Based on the reports from the years 2005 - 2018 the average number of fire-related yearly deaths is 3. The highest number of deaths - 14 took place in 2006, and the lowest - 0 in 2012. The data has a decreasing trend.
The average number of deaths per 1,000 fires is 3. This indicator was the highest - 15 in 2009, and the lowest 0 in 2012. The trend for deaths per 1,000 fires is decreasing. Compared to the Ohio value the number of deaths per 1,000 fire incidents is much higher.
Based on the reports from the years 2005 - 2018 the average number of fire-related yearly deaths is 3. The highest number of deaths - 14 took place in 2006, and the lowest - 0 in 2012. The data has a decreasing trend.
The average number of deaths per 1,000 fires is 3. This indicator was the highest - 15 in 2009, and the lowest 0 in 2012. The trend for deaths per 1,000 fires is decreasing. Compared to the Ohio value the number of deaths per 1,000 fire incidents is much higher.Deaths per 1,000 incidents in Cleveland, OH compared to nearest cities:
(Note: Based on data for all years, including only cities with at least 2,500 fire incidents)
| Cleveland: | 5.8 |
| Parma: | 0.7 |
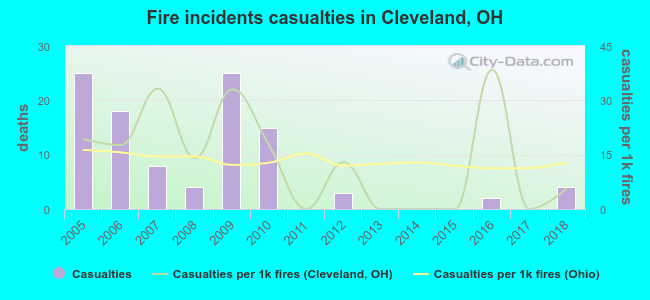 Based on the data from the years 2005 - 2018 the average number of fire-related casualties per year is 7. The highest number of reported injuries - 25 took place in 2005, and the lowest - 0 in 2011. The data has a dropping trend.
The average number of injuries per 1,000 fires is 14. This indicator was the highest - 38 in 2016, and the lowest 0 in 2011. The trend for injuries per 1,000 incidents is dropping. Compared to the state value the number of casualties per 1,000 fire incidents is higher.
Based on the data from the years 2005 - 2018 the average number of fire-related casualties per year is 7. The highest number of reported injuries - 25 took place in 2005, and the lowest - 0 in 2011. The data has a dropping trend.
The average number of injuries per 1,000 fires is 14. This indicator was the highest - 38 in 2016, and the lowest 0 in 2011. The trend for injuries per 1,000 incidents is dropping. Compared to the state value the number of casualties per 1,000 fire incidents is higher.Casualties per 1,000 incidents in Cleveland, OH compared to nearest cities:
(Note: Based on data for all years, including only cities with at least 500 fire incidents)
| Cleveland: | 17.3 |
| Brooklyn: | 6.3 |
| Garfield Heights: | 16.2 |
| East Cleveland: | 13.0 |
| Cleveland Heights: | 16.1 |
| Shaker Heights: | 49.0 |
| Lakewood: | 33.3 |
| University Heights: | 17.9 |
| Parma: | 19.1 |
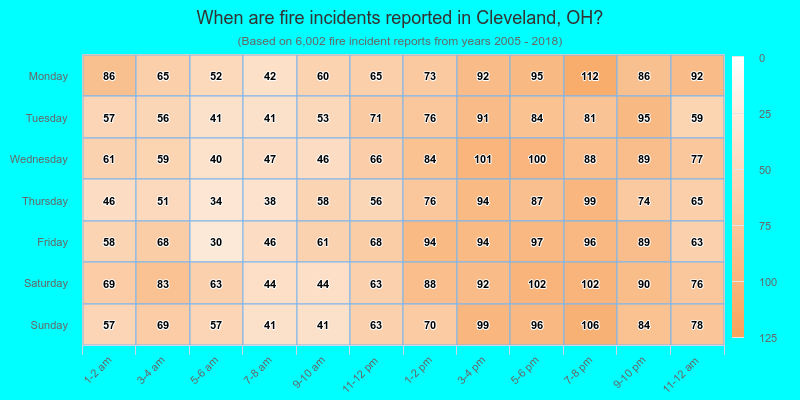
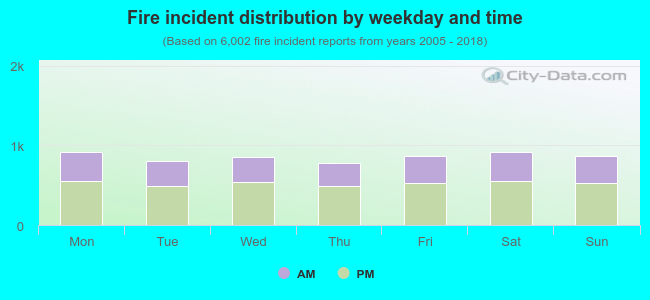 38.6% incidents where reported in the morning and 61.4% in the evening. The most fires (15.3%) took place on Monday, and the least (13.0%) on Thursday.
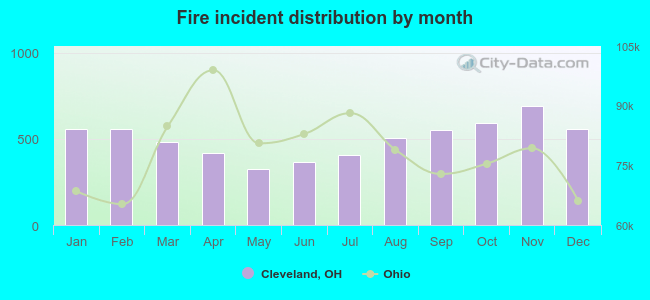 According to the 6,002 fires from years 2005 - 2018 most fires (11.5%) took place during November, and the least (5.4%) in May.
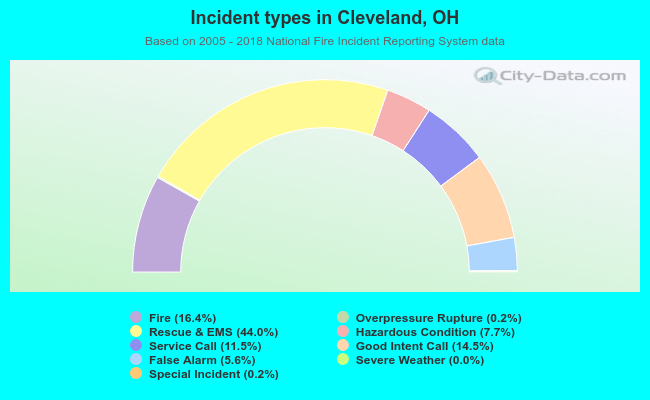 Out of all 36,648 cases reported during the years 2005 - 2018, the most belonged to the categories: Rescue & EMS (44.0%), Fire (16.4%), and Good Intent Call (14.5%).
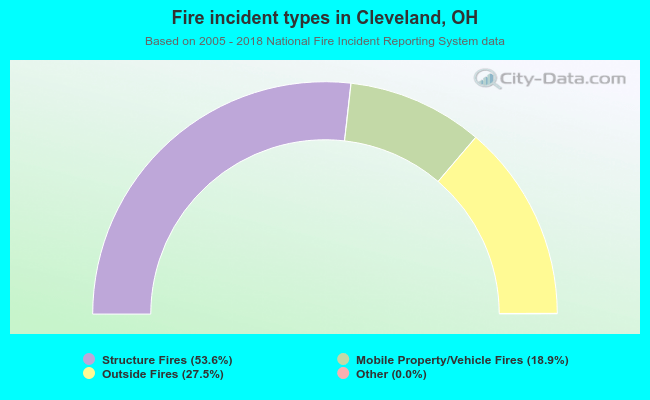 When looking into fire subcategories, the most incidents belonged to: Structure Fires (53.6%), and Outside Fires (27.5%).