Coldwater: Fire Incidents, Michigan (MI)
Where are fire incidents reported in Coldwater, MI
Something went wrong! Please refresh the page.
| Fire incidents reported | |
|---|---|
| Sreet name | Count |
| CHICAGO ST | 292 |
| MARSHALL RD | 68 |
| ANGOLA RD | 58 |
| CHICAGO RD | 56 |
| GARFIELD AVE | 56 |
| UNION CITY RD | 56 |
| MICHIGAN AVE | 54 |
| FISKE RD | 52 |
| CLAY ST | 46 |
| JONESVILLE RD | 42 |
| DAYBURG RD | 40 |
| GIRARD RD | 38 |
| STATE ST | 36 |
| I 69 SOUTH | 34 |
| PEARL ST | 34 |
| SOUTHERN RD | 32 |
| WASHINGTON ST | 32 |
| CENTRAL RD | 30 |
| JAY ST | 30 |
| HUDSON ST | 28 |
| JEFFERSON ST | 28 |
| RACE ST | 28 |
| FILLMORE RD | 26 |
| PARK AVE | 26 |
| SPRAGUE ST | 26 |
| I 69 NORTH | 24 |
| MARSHALL ST | 24 |
| RIVER RD | 24 |
| MORSE ST | 22 |
| PEARL RD | 22 |
| Other | 126 |
2002 - 2018 National Fire Incident Reporting System (NFIRS) incidents
- Incident types reported to NFIRS in Coldwater, MI
- 4,64947.2%Rescue & EMS
- 1,49015.1%Fire
- 1,27212.9%Hazardous Condition
- 9339.5%False Alarm
- 8708.8%Good Intent Call
- 5845.9%Service Call
- 350.4%Overpressure Rupture
- 130.1%Severe Weather
- 100.1%Special Incident
- Fire incident types reported to NFIRS in Coldwater, MI
- 64043.0%Structure Fires
- 51434.5%Outside Fires
- 32121.5%Mobile Property/Vehicle Fires
- 151.0%Other
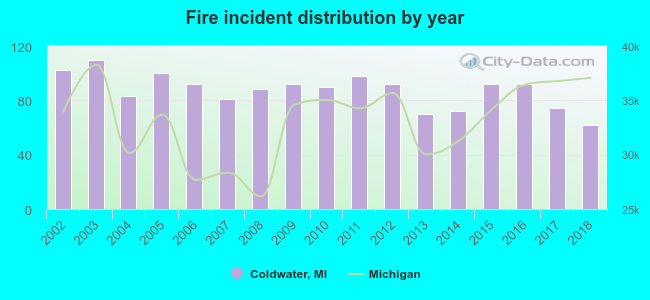 Based on the data from the years 2002 - 2018 the average number of fire incidents per year is 88. The highest number of fires - 110 took place in 2003, and the least - 62 in 2018. The data has a declining trend.
The average number of yearly fire incidents per 10k residents in Coldwater, MI compared to nearest cities:
(Note: Based on data for the last 3 years, including only cities with population 5,000 and above)
| Coldwater: | 70.3 |
| Hillsdale: | 35.2 |
| Marshall: | 75.8 |
| Sturgis: | 11.0 |
| Albion: | 93.5 |
| Battle Creek: | 54.7 |
| Springfield: | 46.1 |
| Three Rivers: | 23.2 |
| Portage: | 23.9 |
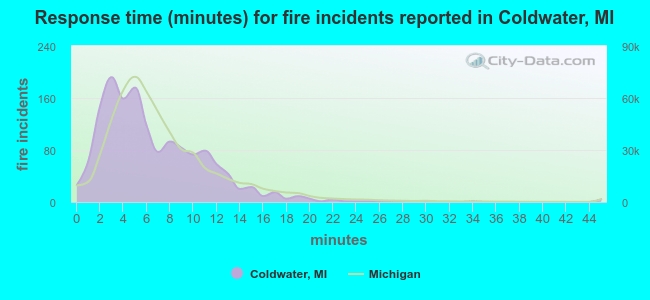 The median response time based on all reported fire incidents is 5 minutes. This is lower than the Michigan median value.
The median response time in Coldwater, MI compared to nearest cities:
(Note: Based on data for all years, including only cities with at least 500 fire incidents)
| Coldwater: | 5 minutes |
| Union City: | 8 minutes |
| Fremont: | 8 minutes |
| Hillsdale: | 6 minutes |
| Angola: | 8 minutes |
| Marshall: | 7 minutes |
| Sturgis: | 6 minutes |
| Albion: | 5 minutes |
| Battle Creek: | 5 minutes |
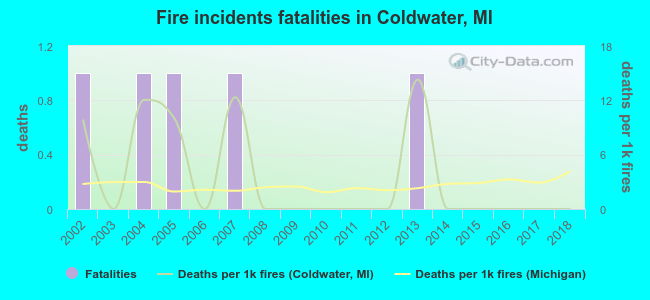 Based on the reports from the years 2002 - 2018 the average number of fire-related fatalities per year is 0. The highest number of reported deaths - 1 took place in 2002, and the lowest - 0 in 2003. The data has a decreasing trend.
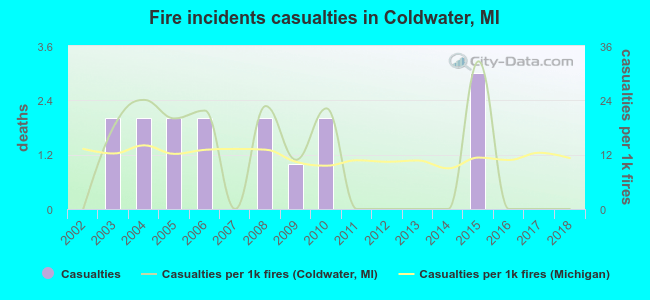 According to the reports from the years 2002 - 2018 the average number of fire-related yearly casualties is 1. The highest number of reported casualties - 3 took place in 2015, and the lowest - 0 in 2002. The data has a constant trend.
The average number of injuries per 1,000 fire incidents is 10. This indicator was the highest - 33 in 2015, and the lowest 0 in 2002. The trend for injuries per 1,000 fire incidents is constant. Compared to the Michigan value the number of casualties per 1,000 fires is similar.
According to the reports from the years 2002 - 2018 the average number of fire-related yearly casualties is 1. The highest number of reported casualties - 3 took place in 2015, and the lowest - 0 in 2002. The data has a constant trend.
The average number of injuries per 1,000 fire incidents is 10. This indicator was the highest - 33 in 2015, and the lowest 0 in 2002. The trend for injuries per 1,000 fire incidents is constant. Compared to the Michigan value the number of casualties per 1,000 fires is similar.Casualties per 1,000 incidents in Coldwater, MI compared to nearest cities:
(Note: Based on data for all years, including only cities with at least 500 fire incidents)
| Coldwater: | 10.7 |
| Union City: | 1.8 |
| Fremont: | 2.3 |
| Hillsdale: | 4.8 |
| Angola: | 14.0 |
| Marshall: | 8.6 |
| Sturgis: | 14.4 |
| Albion: | 8.8 |
| Battle Creek: | 13.2 |
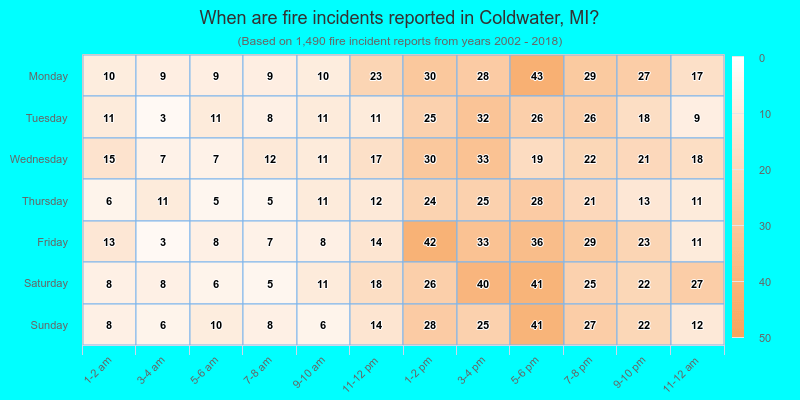
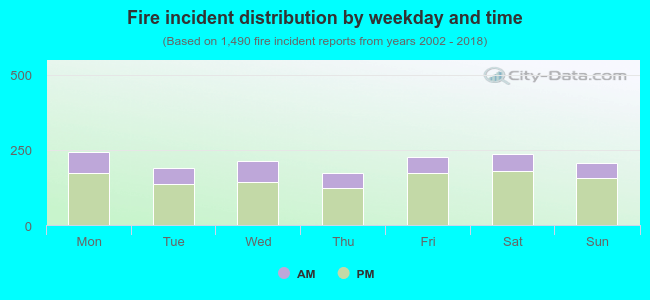 27.2% incidents where reported in the morning and 72.8% in the evening. The most fires (16.4%) took place on Monday, and the least (11.5%) on Thursday.
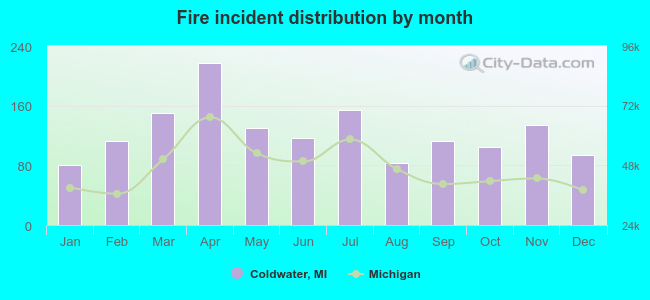 Based on the 1,490 incident reports from years 2002 - 2018 most fires (14.6%) took place during April, and the least (5.4%) in January.
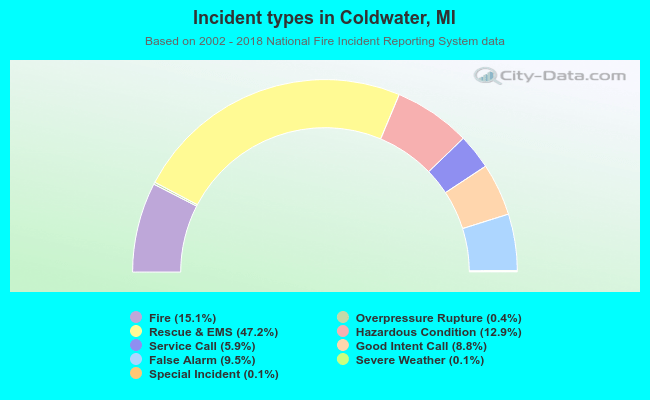 Out of all 9,856 cases reported during the years 2002 - 2018, the most belonged to the categories: Rescue & EMS (47.2%), Fire (15.1%), and Hazardous Condition (12.9%).
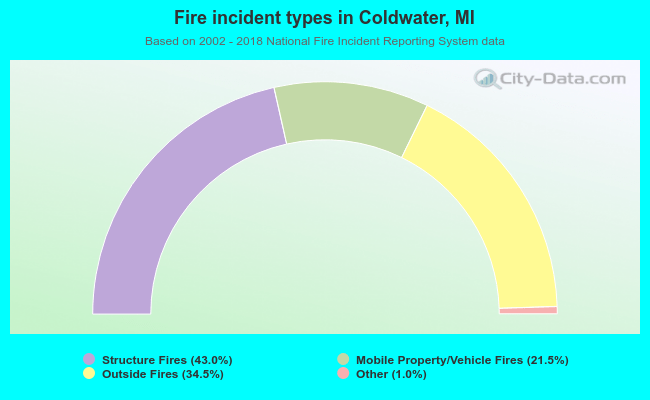 When looking into fire subcategories, the most reports belonged to: Structure Fires (43.0%), and Outside Fires (34.5%).