Collierville: Fire Incidents, Tennessee (TN)
Where are fire incidents reported in Collierville, TN
Something went wrong! Please refresh the page.
| Fire incidents reported | |
|---|---|
| Sreet name | Count |
| POPLAR | 232 |
| BYHALIA RD | 190 |
| HOUSTON LEVEE RD | 146 |
| POPLAR AV | 84 |
| SEVENTY TWO HWY | 70 |
| HIGHWAY 196 HWY | 58 |
| POPLAR AVE | 58 |
| CENTER ST | 48 |
| PETERSON LAKE RD | 44 |
| ROWLETT | 42 |
| QUINN RD | 38 |
| SOUTH ST | 38 |
| FRANK | 34 |
| MERCHANTS PARK CIR | 34 |
| HIGHWAY 193 HWY | 32 |
| HOLMES RD | 32 |
| MT. PLEASANT | 32 |
| SHELBY DR | 32 |
| POWELL RD | 28 |
| QUINN | 28 |
| SYCAMORE RD | 28 |
| NONCONNAH PKY | 26 |
| SHEA RD | 26 |
| SHELTON | 26 |
| WOLF RIVER BLVD | 26 |
| FLEMING RD | 24 |
| BRAY STATION RD | 22 |
| COLLIERVILLE ARLINGTON | 22 |
| NONCONNAH | 22 |
| FISHERVILLE RD | 20 |
| Other | 779 |
2002 - 2018 National Fire Incident Reporting System (NFIRS) incidents
- Incident types reported to NFIRS in Collierville, TN
- 12,04556.2%Rescue & EMS
- 2,80113.1%False Alarm
- 2,32110.8%Fire
- 2,0569.6%Hazardous Condition
- 1,3626.4%Service Call
- 7293.4%Good Intent Call
- 510.2%Severe Weather
- 420.2%Overpressure Rupture
- Fire incident types reported to NFIRS in Collierville, TN
- 1,04344.9%Outside Fires
- 89138.4%Structure Fires
- 37015.9%Mobile Property/Vehicle Fires
- 170.7%Other
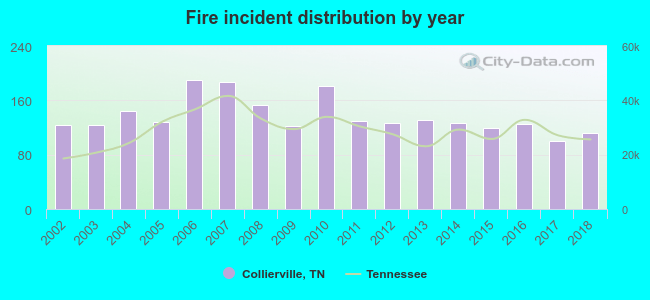 According to the data from the years 2002 - 2018 the average number of fires per year is 137. The highest number of fire incidents - 190 took place in 2006, and the least - 100 in 2017. The data has a decreasing trend.
The average number of yearly fire incidents per 10k residents in Collierville, TN compared to nearest cities:
(Note: Based on data for the last 3 years, including only cities with population 5,000 and above)
| Collierville: | 23.1 |
| Germantown: | 22.6 |
| Lakeland: | 21.0 |
| Bartlett: | 19.2 |
| Oakland: | 92.0 |
| Arlington: | 86.2 |
| Memphis: | 53.0 |
| Millington: | 173.9 |
| Atoka: | 78.0 |
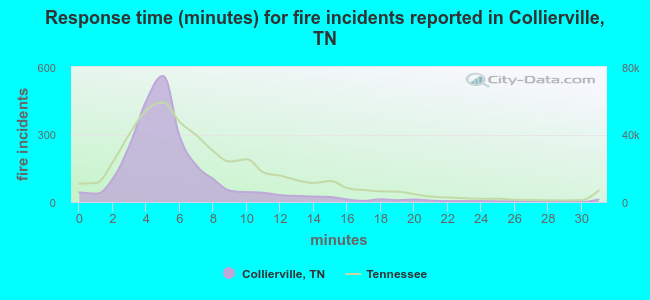 The median response time based on all reported fire incidents is 5 minutes. This is lower than the state median value.
The median response time in Collierville, TN compared to nearest cities:
(Note: Based on data for all years, including only cities with at least 500 fire incidents)
| Collierville: | 5 minutes |
| Germantown: | 5 minutes |
| Olive Branch: | 6 minutes |
| Byhalia: | 12 minutes |
| Bartlett: | 5 minutes |
| Oakland: | 8 minutes |
| Arlington: | 6 minutes |
| Moscow: | 13 minutes |
| Memphis: | 5 minutes |
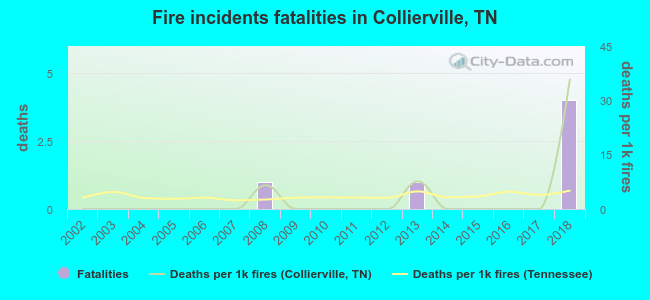 Based on the data from the years 2002 - 2018 the average number of fire-related yearly deaths is 0. The highest number of reported deaths - 4 took place in 2018, and the lowest - 0 in 2002. The data has an increasing trend.
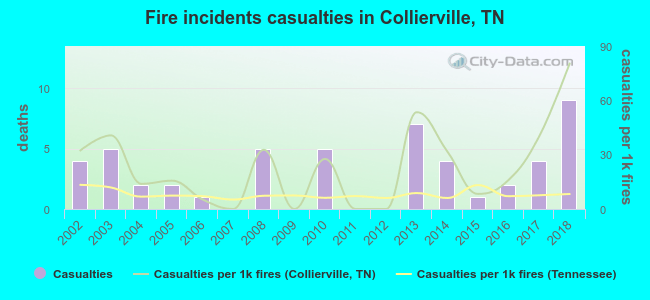 Based on the reports from the years 2002 - 2018 the average number of fire-related yearly casualties is 3. The highest number of injuries - 9 took place in 2018, and the lowest - 0 in 2007. The data has a growing trend.
The average number of injuries per 1,000 fires is 23. This indicator was the highest - 80 in 2018, and the lowest 0 in 2007. The trend for casualties per 1,000 fires is rising. Compared to the state value the number of injuries per 1,000 incidents is much higher.
Based on the reports from the years 2002 - 2018 the average number of fire-related yearly casualties is 3. The highest number of injuries - 9 took place in 2018, and the lowest - 0 in 2007. The data has a growing trend.
The average number of injuries per 1,000 fires is 23. This indicator was the highest - 80 in 2018, and the lowest 0 in 2007. The trend for casualties per 1,000 fires is rising. Compared to the state value the number of injuries per 1,000 incidents is much higher.Casualties per 1,000 incidents in Collierville, TN compared to nearest cities:
(Note: Based on data for all years, including only cities with at least 500 fire incidents)
| Collierville: | 22.0 |
| Germantown: | 32.3 |
| Olive Branch: | 2.8 |
| Byhalia: | 1.7 |
| Bartlett: | 11.5 |
| Oakland: | 8.8 |
| Arlington: | 9.5 |
| Moscow: | 4.1 |
| Memphis: | 4.5 |
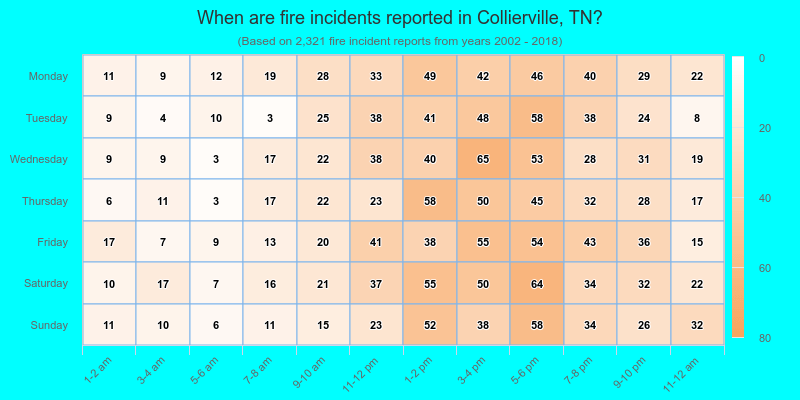
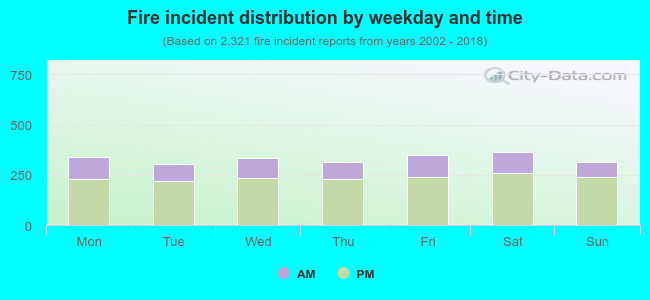 29.0% incidents where reported in the morning and 71.0% in the evening. The most fires (15.7%) took place on Saturday, and the least (13.2%) on Tuesday.
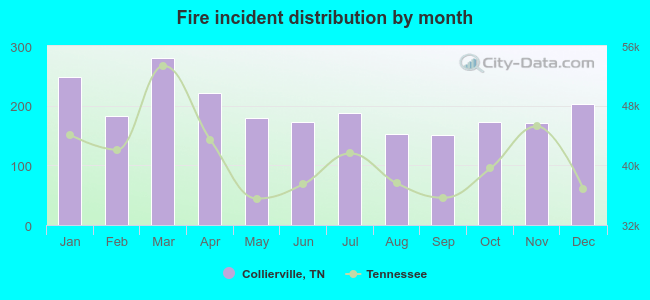 Based on the 2,321 incident reports from years 2002 - 2018 most fires (12.1%) took place during March, and the least (6.5%) in September.
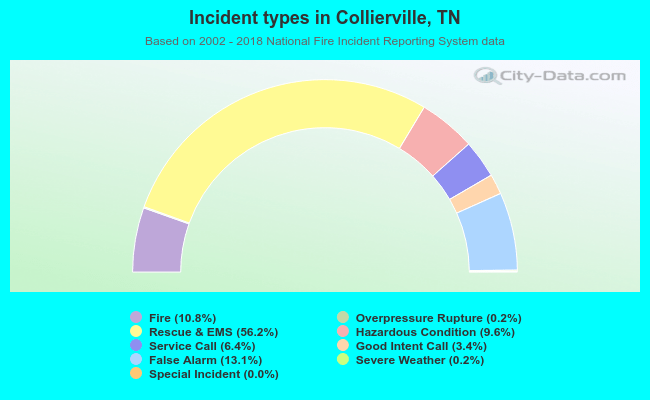 Out of all 21,417 cases reported during the years 2002 - 2018, the most belonged to the categories: Rescue & EMS (56.2%), False Alarm (13.1%), and Fire (10.8%).
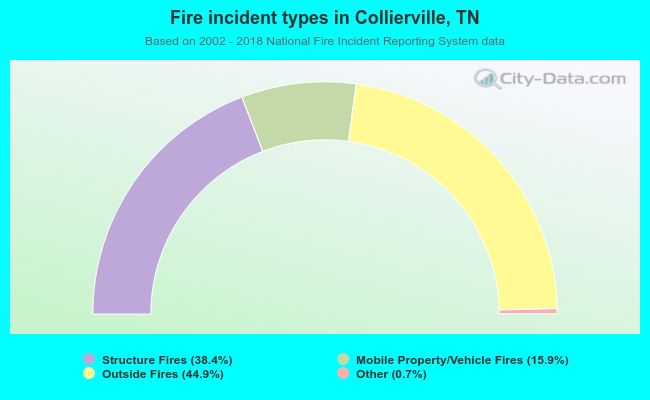 When looking into fire subcategories, the most incidents belonged to: Outside Fires (44.9%), and Structure Fires (38.4%).