| Fire incidents reported |
|---|
| Sreet name | Count |
|---|
| CAINS MILL RD | 24 | | LAKE GEORGE DR | 16 | | CAINS MILL ROAD | 12 | | BEACH RD | 10 | | BEACH RD | 8 | | CAINS MILL | 8 | | WILDWOOD AVE | 8 | | COLIN LANE | 6 | | EAST COLLINGS DR | 6 | | JAYS AVE | 6 | | MALAGA | 6 | | MALAGA RD | 6 | | BEACH ROAD | 4 | | CEDAR LAKE DR. | 4 | | CEDAR LAKE DRIV | 4 | | CUSHMAN AVE | 4 | | EVERGREEN AVE | 4 | | MAYFLOWER LANE | 4 | | BELLWYN AVE | 2 | | BLACK HORSE PIKE | 2 | | BLACKHORSE PIKE | 2 | | BRADDOCK AVE | 2 | | CAIN MILL | 2 | | CAINS MILLS RD | 2 | | CAINSMILL ROAD | 2 |
| | | Fire incidents reported |
|---|
| Sreet name | Count |
|---|
| CEDAR LAKE DR | 2 | | CEDAR LAKE DR | 2 | | CEDAR LANE | 2 | | COLES MILL ROAD | 2 | | COLIN LN | 2 | | COLLINGS | 2 | | COLLINGS DR | 2 | | COLLINGS DRIVE | 2 | | COLLINS DRIV | 2 | | COLTON LN | 2 | | DELWYN LANE | 2 | | EDGEWOOD | 2 | | EDGEWOOD DR | 2 | | FENIMORE DR | 2 | | FOX LANE | 2 | | JACKSON ROAD | 2 | | LADE DRIV | 2 | | LAKE GEORGE | 2 | | LAKE GEORGE DRIV | 2 | | LAKE GEORGE DRIVE | 2 | | LINDEN | 2 | | MAYFLOWER DR | 2 | | SHERWOOD DRIV | 2 | | SOUTH RIVER DRIVE | 2 | | W BEACH | 2 |
|
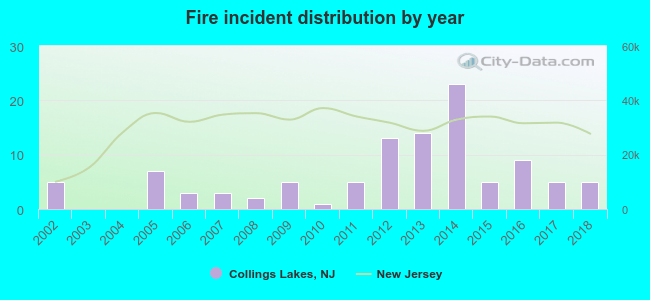 According to the data from the years 2002 - 2018 the average number of fires per year is 6. The highest number of reported fire incidents - 23 took place in 2014, and the least - 0 in 2003. The data has a constant trend.
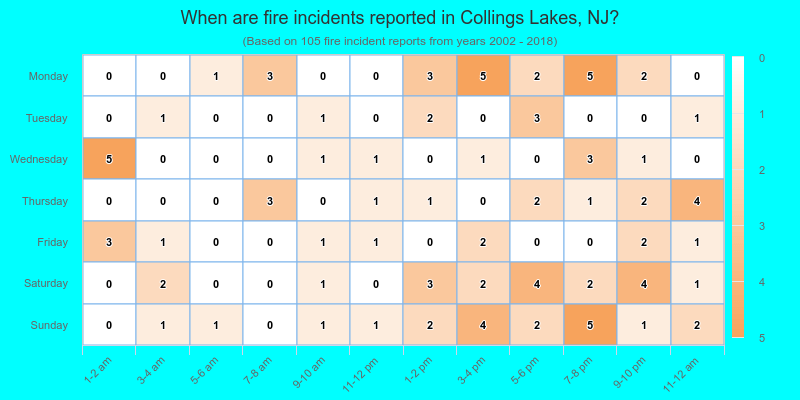
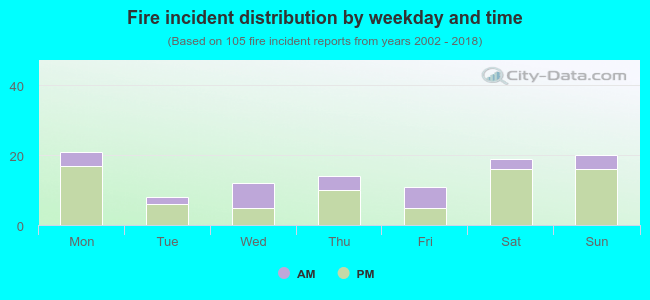 28.6% incidents where reported in the morning and 71.4% in the evening. The most fires (20.0%) took place on Monday, and the least (7.6%) on Tuesday.
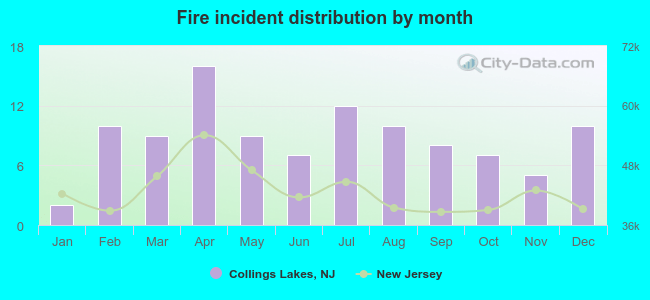 Based on the 105 fire incidents from years 2002 - 2018 most fires (15.2%) took place during April, and the least (1.9%) in January.
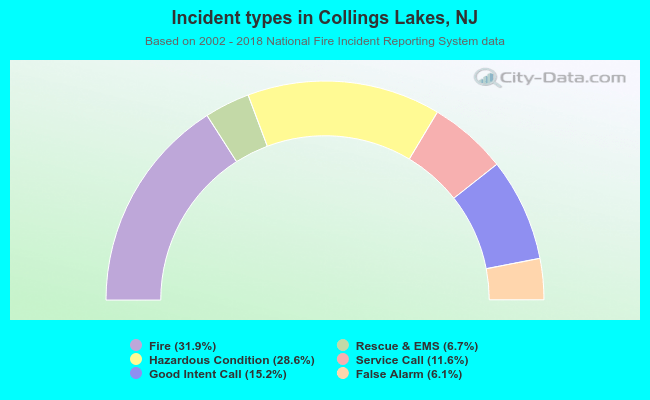 Out of all 329 cases reported during the years 2002 - 2018, the most belonged to the categories: Fire (31.9%), Rescue & EMS (28.6%), and Service Call (15.2%).
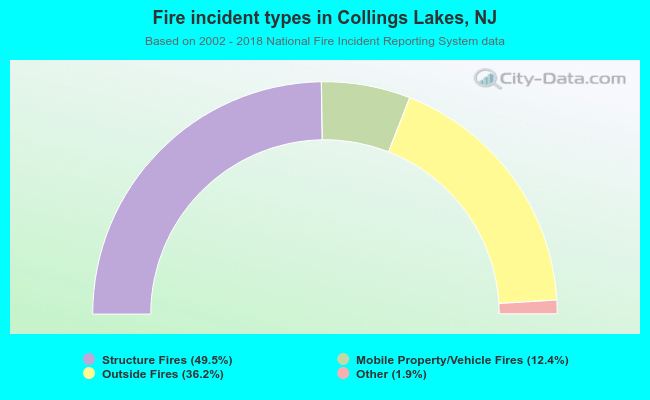 When looking into fire subcategories, the most incidents belonged to: Structure Fires (49.5%), and Outside Fires (36.2%).