| Fire incidents reported |
|---|
| Sreet name | Count |
|---|
| MAIN RD | 106 | | ADAMSVILLE RD | 44 | | FOUNDRY VILLAGE RD | 24 | | WILSON HILL RD | 22 | | JACKSONVILLE RD | 20 | | COLRAIN RD | 16 | | ED CLARK RD | 16 | | GREENFIELD RD | 14 | | THOMPSON RD | 14 | | CHURCH ST | 10 | | DWIGHT CROSS RD | 10 | | MERRIFIELD LN | 10 | | ARCHAMBO RD | 8 | | CALL RD | 8 | | GRISWOLDVILLE ST | 8 | | LEYDEN RD | 8 | | MAIN ROAD | 8 | | PROLOVICH RD | 8 | | RIVER ST | 8 | | CALVIN COOMBS RD | 6 | | JESSE WOOD LN | 6 | | JUREK RD | 6 | | PURINGTON LN | 6 | | SHEARER RD | 6 | | SHELBURNE LINE RD | 6 |
| | | Fire incidents reported |
|---|
| Sreet name | Count |
|---|
| W LEYDEN RD | 6 | | CATAMOUNT HILL RD | 4 | | CHRISTIAN HILL RD | 4 | | CROMACK LANE | 4 | | E COLRAIN RD | 4 | | EAST COLRAIN ROAD RD | 4 | | FRANKLIN HILL RD | 4 | | GREEN RIVER LN | 4 | | GREEN RIVER RD | 4 | | HEATH RD | 4 | | JESSE WOOD LANE | 4 | | MAIN | 4 | | MAIN ST | 4 | | NEW COUNTY RD | 4 | | NEW COUNTY ROAD | 4 | | 42 PURINGTON LANE | 2 | | ADAMSVILLE RD | 2 | | ADAMSVILLE ROAD | 2 | | ARCHAMBAULT RD | 2 | | ARCHAMBO ROAD | 2 | | ASHFIELD RD | 2 | | BRANCH HILL RD | 2 | | BROWN RD | 2 | | CALVIN COOMBS RAOD | 2 | | |
|
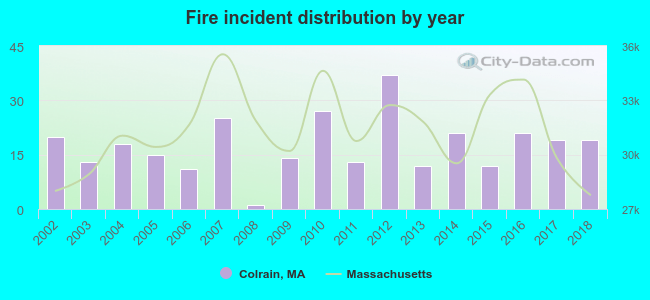 According to the data from the years 2002 - 2018 the average number of fires per year is 18. The highest number of reported fires - 37 took place in 2012, and the least - 1 in 2008. The data has a declining trend.
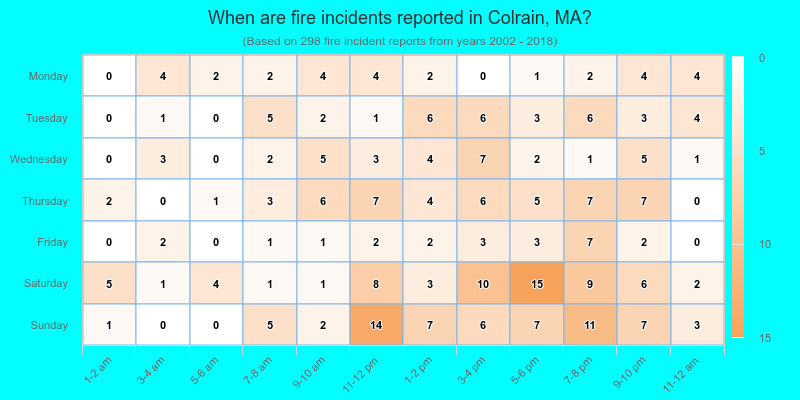
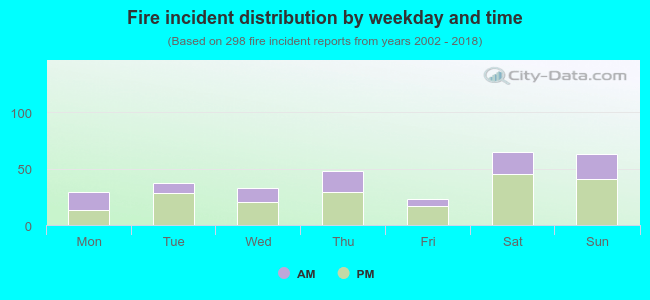 35.2% incidents where reported in the morning and 64.8% in the evening. The most fires (21.8%) took place on Saturday, and the least (7.7%) on Friday.
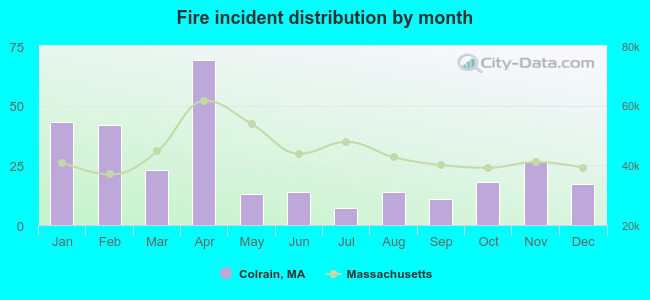 According to the 298 fires from years 2002 - 2018 most fires (23.2%) took place during April, and the least (2.3%) in July.
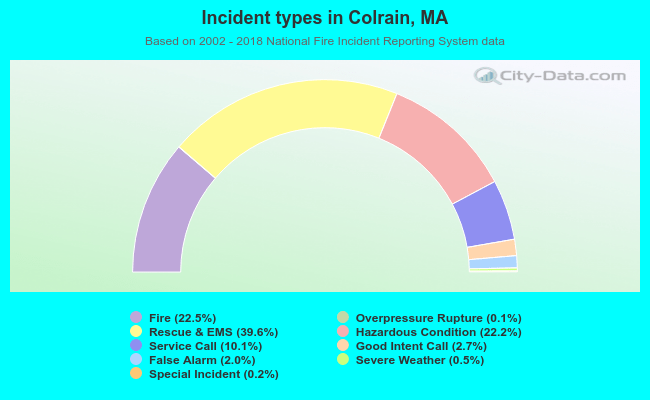 Out of all 1,323 cases reported during the years 2002 - 2018, the most belonged to the categories: Rescue & EMS (39.6%), Fire (22.5%), and Hazardous Condition (22.2%).
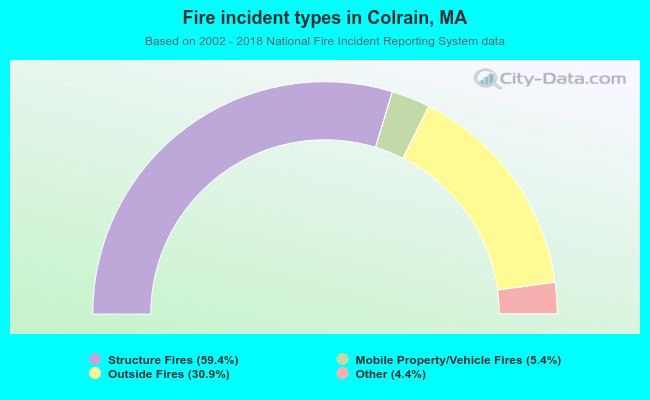 When looking into fire subcategories, the most reports belonged to: Structure Fires (59.4%), and Outside Fires (30.9%).