Commerce: Fire Incidents, Texas (TX)
Where are fire incidents reported in Commerce, TX
Something went wrong! Please refresh the page.
| Fire incidents reported | |
|---|---|
| Sreet name | Count |
| HWY 224 | 160 |
| HWY 50 | 158 |
| HWY 24 | 86 |
| CULVER ST | 74 |
| HWY 11 | 74 |
| LIVE OAK ST | 72 |
| FM 2874 | 66 |
| FM 118 | 64 |
| FM 3218 | 56 |
| FM 904 | 56 |
| PARK ST | 56 |
| MAPLE ST | 52 |
| FM 512 | 48 |
| CR 4514 | 42 |
| CR 4400 | 38 |
| CR 4604 | 38 |
| FM 71 | 38 |
| SYCAMORE ST | 38 |
| WASHINGTON ST | 38 |
| JACKSON ST | 36 |
| CADDO ST | 34 |
| CR 4220 | 34 |
| LIVE OAK | 34 |
| MONROE ST | 34 |
| WEST HALL | 32 |
| CR 4506 | 28 |
| CR 4516 | 28 |
| CR 4511 | 26 |
| FM 2068 | 26 |
| TAYLOR ST | 26 |
| Other | 619 |
2002 - 2018 National Fire Incident Reporting System (NFIRS) incidents
- Incident types reported to NFIRS in Commerce, TX
- 4,02641.4%Rescue & EMS
- 2,21122.7%Fire
- 2,00020.6%Hazardous Condition
- 6516.7%Good Intent Call
- 4664.8%Service Call
- 3393.5%False Alarm
- 190.2%Overpressure Rupture
- 130.1%Special Incident
- Fire incident types reported to NFIRS in Commerce, TX
- 1,22455.4%Outside Fires
- 70732.0%Structure Fires
- 22210.0%Mobile Property/Vehicle Fires
- 582.6%Other
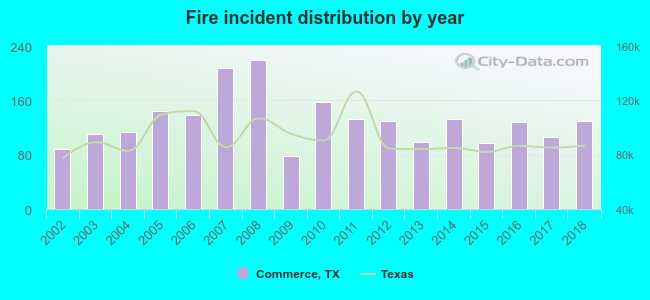 Based on the data from the years 2002 - 2018 the average number of fires per year is 130. The highest number of reported fire incidents - 219 took place in 2008, and the least - 78 in 2009. The data has an increasing trend.
The average number of yearly fire incidents per 10k residents in Commerce, TX compared to nearest cities:
(Note: Based on data for the last 3 years, including only cities with population 5,000 and above)
| Commerce: | 140.7 |
| Greenville: | 80.1 |
| Sulphur Springs: | 99.7 |
| Bonham: | 63.3 |
| Royse City: | 121.2 |
| Princeton: | 102.0 |
| Paris: | 75.2 |
| Fate: | 35.2 |
| Anna: | 104.4 |
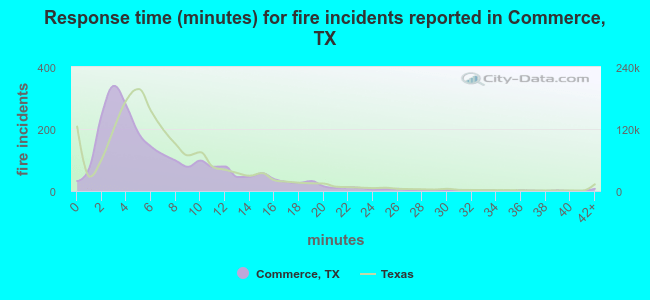 The median response time based on all reported fire incidents is 5 minutes. This is lower than the Texas median value.
The median response time in Commerce, TX compared to nearest cities:
(Note: Based on data for all years, including only cities with at least 500 fire incidents)
| Commerce: | 5 minutes |
| Campbell: | 13 minutes |
| Greenville: | 6 minutes |
| Cooper: | 10 minutes |
| Lone Oak: | 13 minutes |
| Celeste: | 9 minutes |
| Sulphur Springs: | 9 minutes |
| Caddo Mills: | 13 minutes |
| Emory: | 8 minutes |
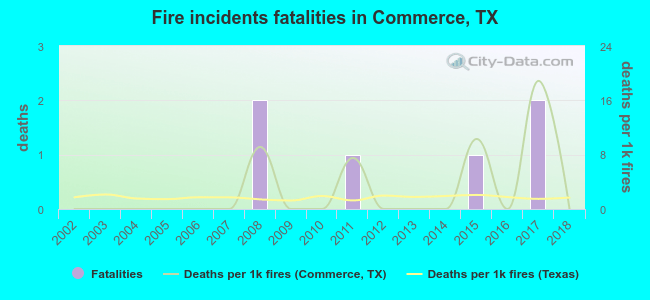 Based on the data from the years 2002 - 2018 the average number of fire-related yearly deaths is 0. The highest number of deaths - 2 took place in 2008, and the lowest - 0 in 2002. The data has a constant trend.
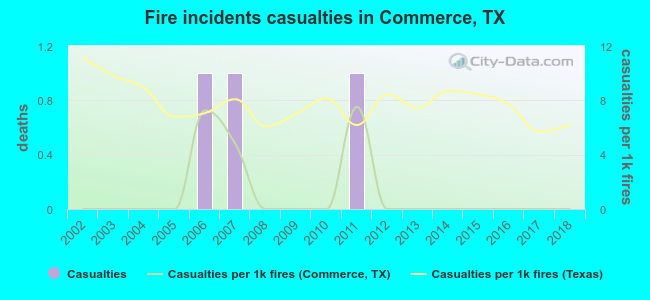 Based on the reports from the years 2002 - 2018 the average number of fire-related yearly casualties is 0. The highest number of injuries - 1 took place in 2006, and the lowest - 0 in 2002. The data has a constant trend.
The average number of casualties per 1,000 fire incidents is 1. This indicator was the highest - 8 in 2011, and the lowest 0 in 2002. The trend for injuries per 1,000 incidents is constant. Compared to the state value the number of casualties per 1,000 fires is much lower.
Based on the reports from the years 2002 - 2018 the average number of fire-related yearly casualties is 0. The highest number of injuries - 1 took place in 2006, and the lowest - 0 in 2002. The data has a constant trend.
The average number of casualties per 1,000 fire incidents is 1. This indicator was the highest - 8 in 2011, and the lowest 0 in 2002. The trend for injuries per 1,000 incidents is constant. Compared to the state value the number of casualties per 1,000 fires is much lower.Casualties per 1,000 incidents in Commerce, TX compared to nearest cities:
(Note: Based on data for all years, including only cities with at least 500 fire incidents)
| Commerce: | 1.4 |
| Campbell: | 0.9 |
| Greenville: | 7.7 |
| Cooper: | 0.0 |
| Lone Oak: | 0.0 |
| Celeste: | 0.0 |
| Sulphur Springs: | 6.6 |
| Caddo Mills: | 0.0 |
| Emory: | 1.7 |
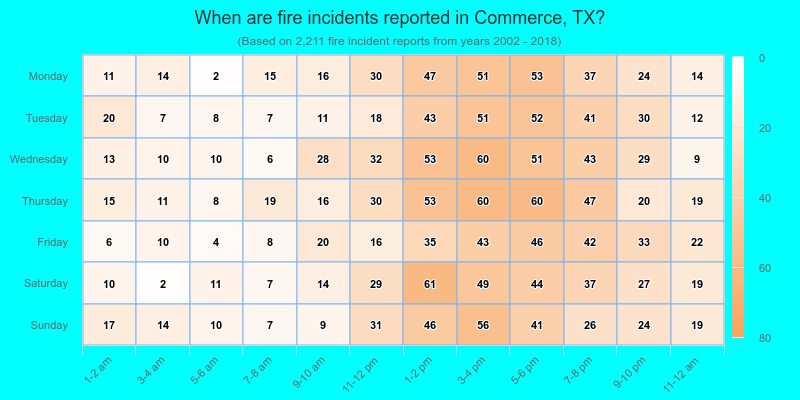
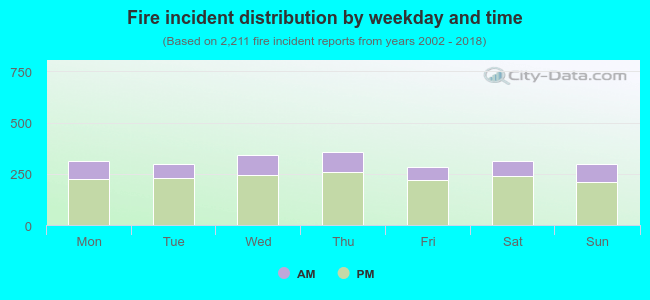 26.3% incidents where reported in the morning and 73.7% in the evening. The most fires (16.2%) took place on Thursday, and the least (12.9%) on Friday.
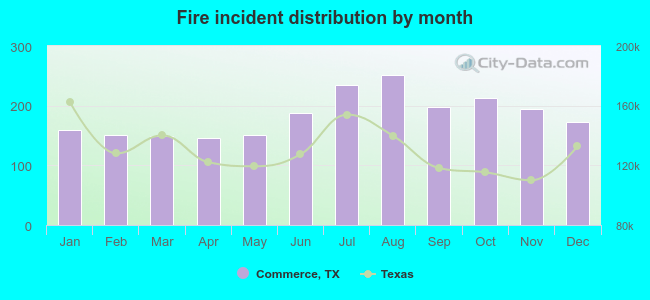 According to the 2,211 fire incidents from years 2002 - 2018 most fires (11.4%) took place during August, and the least (6.6%) in April.
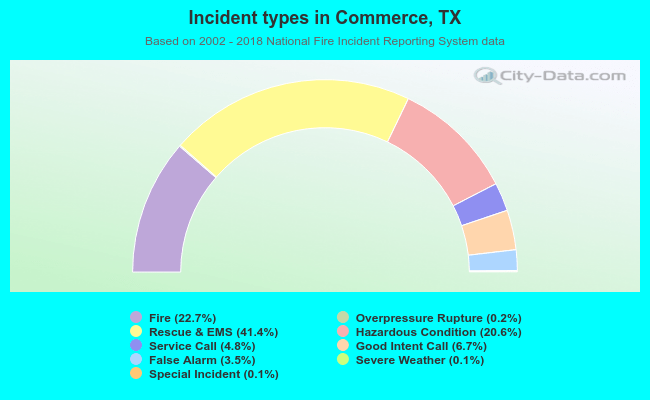 Out of all 9,732 cases reported during the years 2002 - 2018, the most belonged to the categories: Rescue & EMS (41.4%), Fire (22.7%), and Hazardous Condition (20.6%).
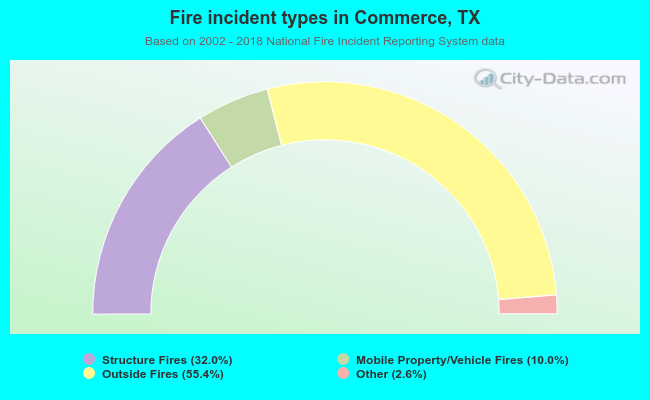 When looking into fire subcategories, the most reports belonged to: Outside Fires (55.4%), and Structure Fires (32.0%).