Congress: Fire Incidents, Arizona (AZ)
Where are fire incidents reported in Congress, AZ
Something went wrong! Please refresh the page.
|
| |||||||||||||||||||||||||||||||||||||||||||||||||||||||||||||||||||||||||||||||||||||||||||||||||||||
2013 - 2018 National Fire Incident Reporting System (NFIRS) incidents
- Incident types reported to NFIRS in Congress, AZ
- 1,02551.6%Rescue & EMS
- 51225.8%Service Call
- 28214.2%Good Intent Call
- 1105.5%Fire
- 311.6%False Alarm
- 221.1%Hazardous Condition
- 40.2%Special Incident
- Fire incident types reported to NFIRS in Congress, AZ
- 6660.0%Outside Fires
- 2623.6%Mobile Property/Vehicle Fires
- 1513.6%Structure Fires
- 32.7%Other
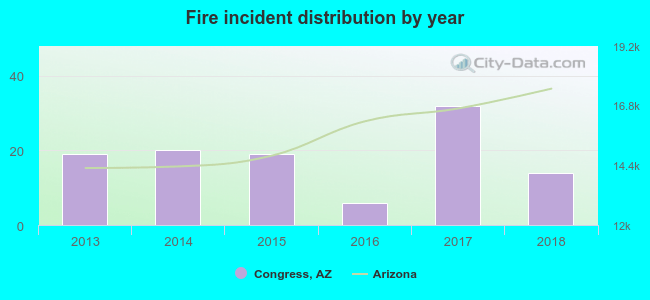 According to the data from the years 2013 - 2018 the average number of fire incidents per year is 18. The highest number of fire incidents - 32 took place in 2017, and the least - 6 in 2016. The data has a declining trend.
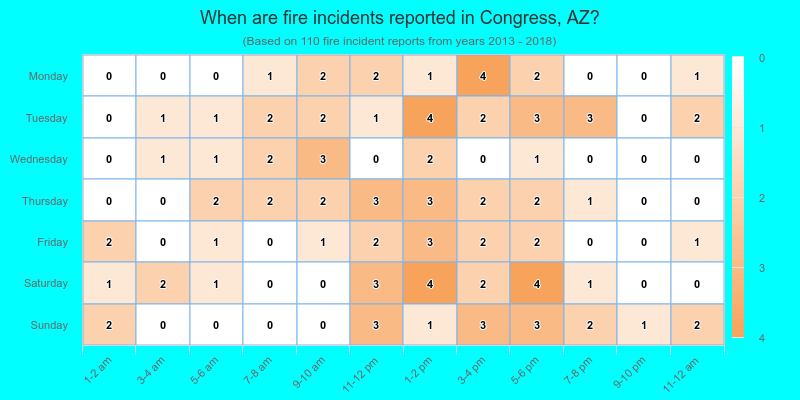
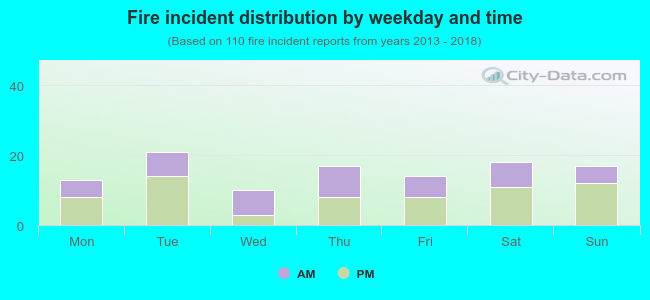 41.8% incidents where reported in the morning and 58.2% in the evening. The most fires (19.1%) took place on Tuesday, and the least (9.1%) on Wednesday.
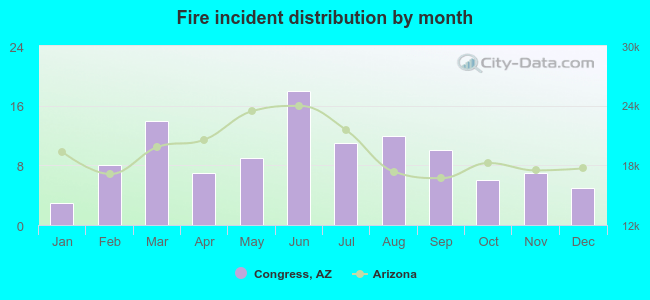 Based on the 110 reports from years 2013 - 2018 most fires (16.4%) took place during June, and the least (2.7%) in January.
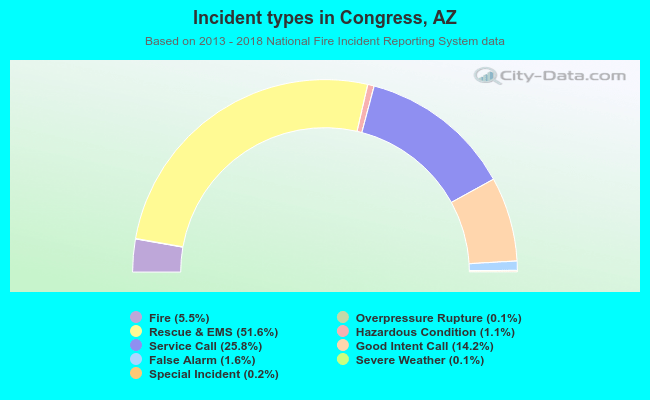 Out of all 1,988 cases reported during the years 2013 - 2018, the most belonged to the categories: Rescue & EMS (51.6%), Service Call (25.8%), and Good Intent Call (14.2%).
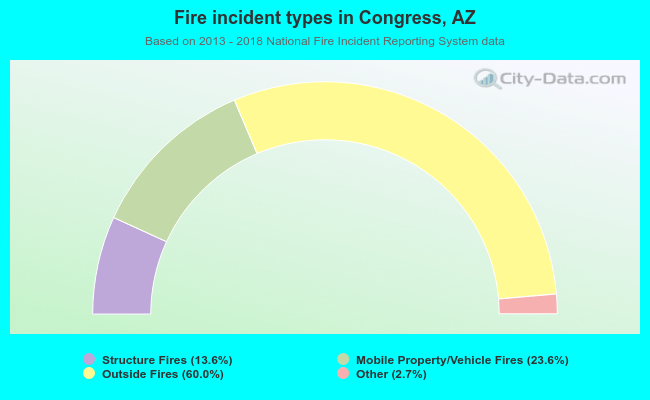 When looking into fire subcategories, the most incidents belonged to: Outside Fires (60.0%), and Mobile Property/Vehicle Fires (23.6%).