| Fire incidents reported |
|---|
| Sreet name | Count |
|---|
| SHELBURNE FALLS RD | 40 | | MAIN POLAND RD | 24 | | WHATELY RD | 20 | | ASHFIELD RD | 18 | | GRAVES RD | 14 | | WILLIAMSBURG RD | 14 | | BAPTIST HILL RD | 12 | | MAIN ST | 12 | | THOMPSON RD | 12 | | CONWAY STATION RD | 10 | | DEERFIELD RD | 10 | | HART RD | 10 | | PLEASANT ST | 10 | | ROARING BROOK RD | 10 | | SHIRKSHIRE RD | 10 | | BARDWELLS FERRY RD | 8 | | MAPLE ST | 8 | | NEWHALL RD | 8 | | CEMETERY HILL RD | 6 | | ELM ST | 6 | | GUINEA RD | 6 | | HOOSAC RD | 6 | | POLAND RD | 6 | | DELABARRE AVE | 4 | | GRAVES RD | 4 |
| | | Fire incidents reported |
|---|
| Sreet name | Count |
|---|
| JONES CORNER RD | 4 | | MATHEWS RD | 4 | | OLD CRICKET HILL RD | 4 | | REEDS BRIDGE RD | 4 | | RILEY RD | 4 | | SHELBURNE FALLS RD | 4 | | SOUTH DEERFIELD RD | 4 | | WHATLEY RD | 4 | | WILDER HILL RD | 4 | | 3064 CONWAY ROAD | 2 | | ACADEMY HILL RD | 2 | | ASHFIELD RD | 2 | | BENT NAIIL DR | 2 | | BENT NAIL DR | 2 | | BOND ST | 2 | | BOYDEN RD | 2 | | C0NWAY | 2 | | CRICKET HILL RD | 2 | | EAST GUINEA RD | 2 | | EAST GUINIE RD | 2 | | ELDRIDGE RD | 2 | | ELIJAH'S RIDE DR | 2 | | FLAG MOUNTAIN DR | 2 | | HICKERY RIDGE RD | 2 | | |
|
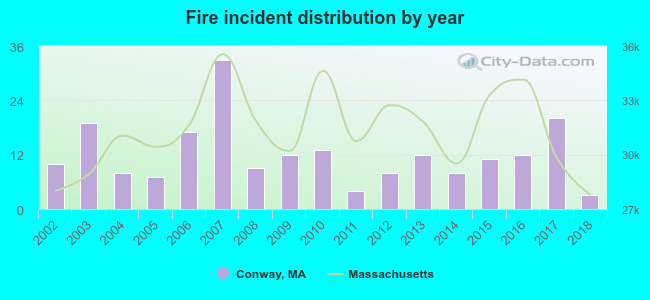 According to the data from the years 2002 - 2018 the average number of fires per year is 12. The highest number of reported fires - 33 took place in 2007, and the least - 3 in 2018. The data has a declining trend.
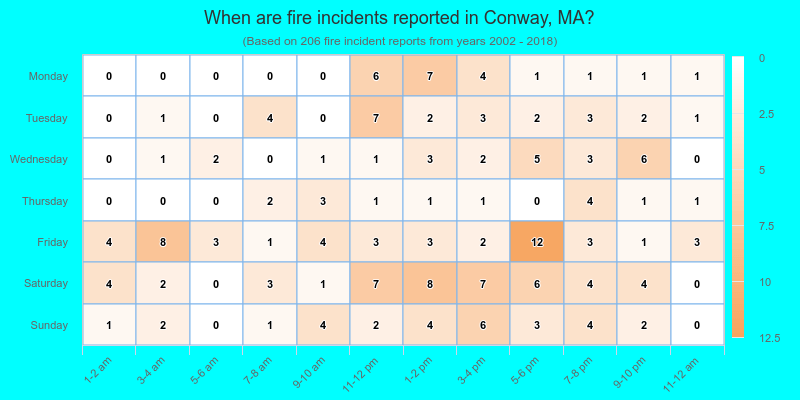
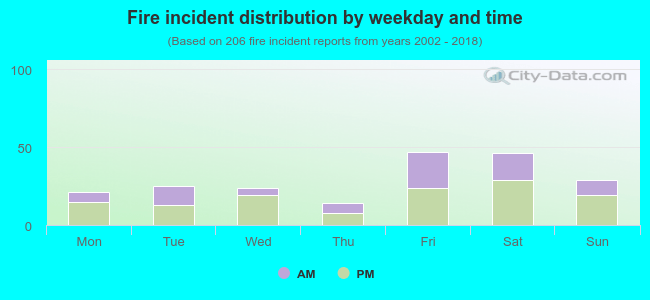 38.3% incidents where reported in the morning and 61.7% in the evening. The most fires (22.8%) took place on Friday, and the least (6.8%) on Thursday.
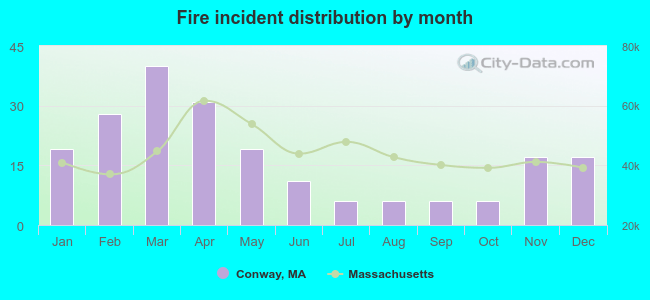 According to the 206 fires from years 2002 - 2018 most fires (19.4%) took place during March, and the least (2.9%) in July.
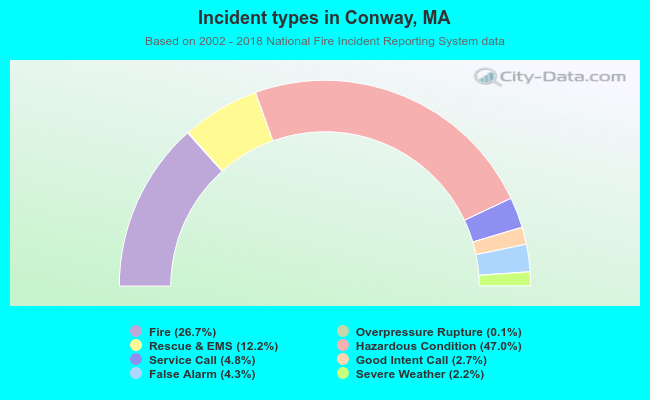 Out of all 771 cases reported during the years 2002 - 2018, the most belonged to the categories: Hazardous Condition (47.0%), Fire (26.7%), and Rescue & EMS (12.2%).
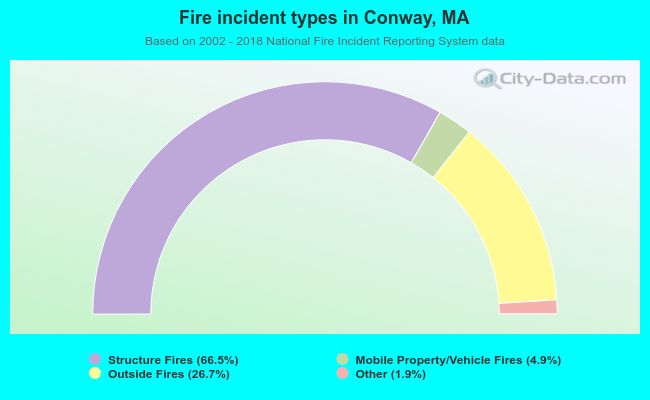 When looking into fire subcategories, the most reports belonged to: Structure Fires (66.5%), and Outside Fires (26.7%).