Cope: Fire Incidents, South Carolina (SC)
Where are fire incidents reported in Cope, SC
Something went wrong! Please refresh the page.
|
| |||||||||||||||||||||||||||||||||||||||||||||||||||||||||||||||||||||||||||||||||||||||||||||||||||||||||||||
2003 - 2018 National Fire Incident Reporting System (NFIRS) incidents
- Incident types reported to NFIRS in Cope, SC
- 57635.9%Fire
- 51932.3%Rescue & EMS
- 18211.3%Severe Weather
- 1388.6%Good Intent Call
- 1237.7%Hazardous Condition
- 332.1%Service Call
- 311.9%False Alarm
- 20.1%Special Incident
- Fire incident types reported to NFIRS in Cope, SC
- 22939.8%Outside Fires
- 21737.7%Structure Fires
- 7613.2%Mobile Property/Vehicle Fires
- 549.4%Other
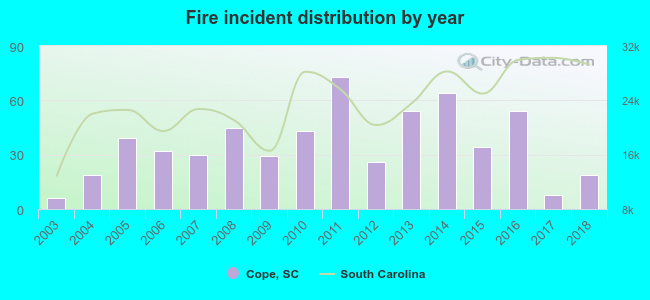 According to the data from the years 2003 - 2018 the average number of fires per year is 36. The highest number of fires - 73 took place in 2011, and the least - 6 in 2003. The data has an increasing trend.
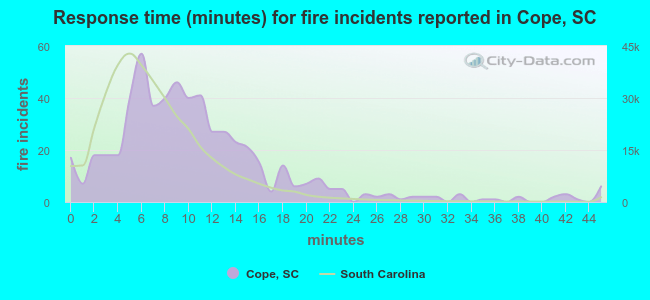 The median response time based on all reported fire incidents is 9 minutes. This is higher than the state median value.
The median response time in Cope, SC compared to nearest cities:
(Note: Based on data for all years, including only cities with at least 500 fire incidents)
| Cope: | 9 minutes |
| Bamberg: | 6 minutes |
| Cordova: | 9 minutes |
| Denmark: | 7 minutes |
| Orangeburg: | 5 minutes |
| Neeses: | 11 minutes |
| Branchville: | 10 minutes |
| North: | 9 minutes |
| Bowman: | 11 minutes |
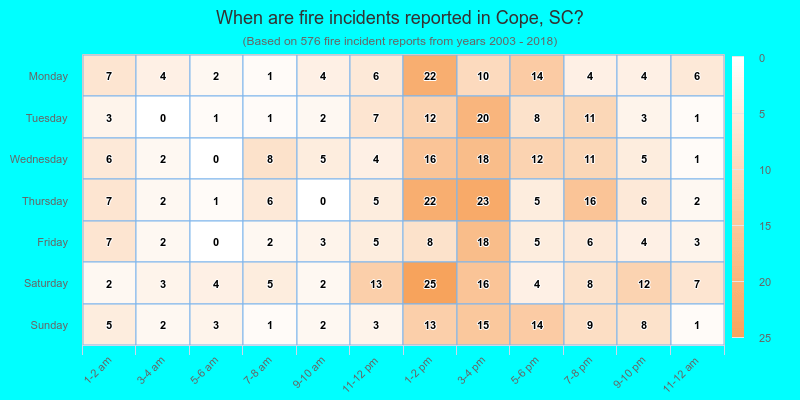
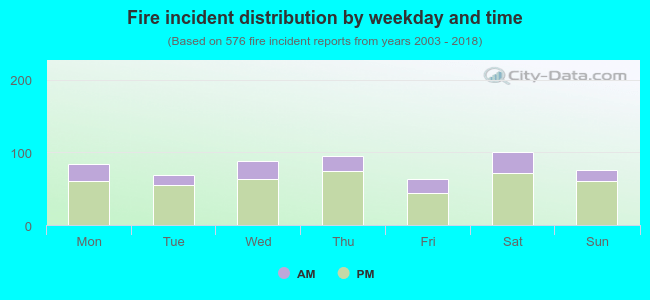 25.7% incidents where reported in the morning and 74.3% in the evening. The most fires (17.5%) took place on Saturday, and the least (10.9%) on Friday.
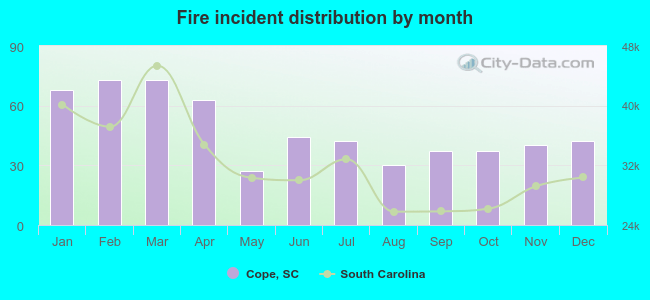 Based on the 576 incident reports from years 2003 - 2018 most fires (12.7%) took place during February, and the least (4.7%) in May.
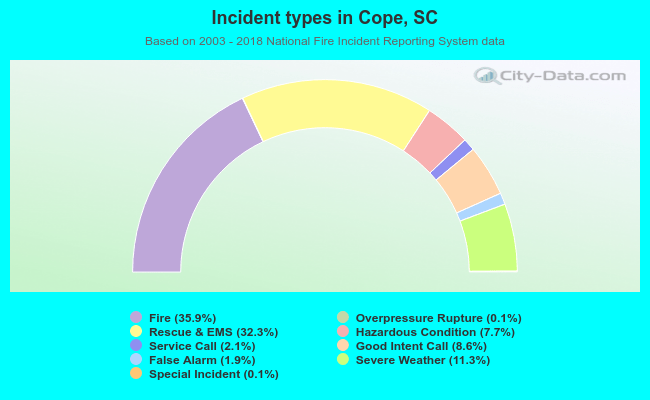 Out of all 1,605 cases reported during the years 2003 - 2018, the most belonged to the categories: Fire (35.9%), Rescue & EMS (32.3%), and Severe Weather (11.3%).
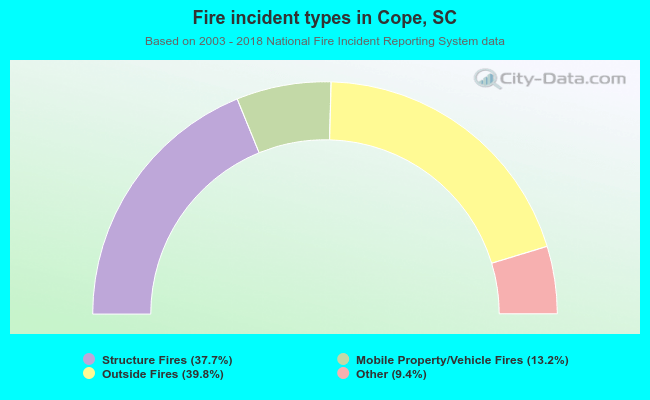 When looking into fire subcategories, the most reports belonged to: Outside Fires (39.8%), and Structure Fires (37.7%).