Copiague: Fire Incidents, New York (NY)
Where are fire incidents reported in Copiague, NY
Something went wrong! Please refresh the page.
|
| |||||||||||||||||||||||||||||||||||||||||||||||||||||||||||||||||||||||||||||||||||||||||||||||||||||||||||||
2003 - 2018 National Fire Incident Reporting System (NFIRS) incidents
- Incident types reported to NFIRS in Copiague, NY
- 66627.5%Rescue & EMS
- 62125.6%Hazardous Condition
- 58124.0%Fire
- 30112.4%False Alarm
- 1877.7%Good Intent Call
- 502.1%Service Call
- 130.5%Special Incident
- 30.1%Overpressure Rupture
- 30.1%Severe Weather
- Fire incident types reported to NFIRS in Copiague, NY
- 29450.6%Structure Fires
- 20334.9%Outside Fires
- 467.9%Mobile Property/Vehicle Fires
- 386.5%Other
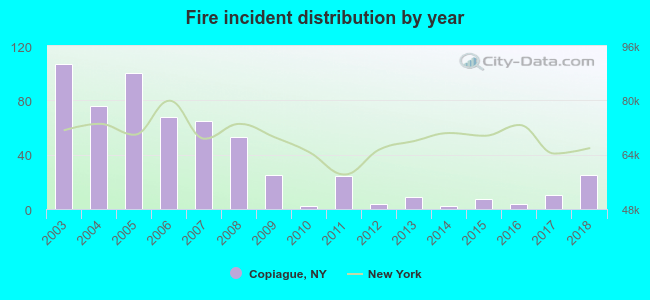 Based on the data from the years 2003 - 2018 the average number of fires per year is 36. The highest number of reported fires - 107 took place in 2003, and the least - 2 in 2010. The data has a decreasing trend.
The average number of yearly fire incidents per 10k residents in Copiague, NY compared to nearest cities:
(Note: Based on data for the last 3 years, including only cities with population 5,000 and above)
| Copiague: | 5.7 |
| Amityville: | 42.0 |
| Lindenhurst: | 37.9 |
| North Amityville: | 1.5 |
| East Massapequa: | 1.6 |
| Massapequa Park: | 17.4 |
| West Babylon: | 0.2 |
| Babylon: | 4.1 |
| East Farmingdale: | 7.7 |
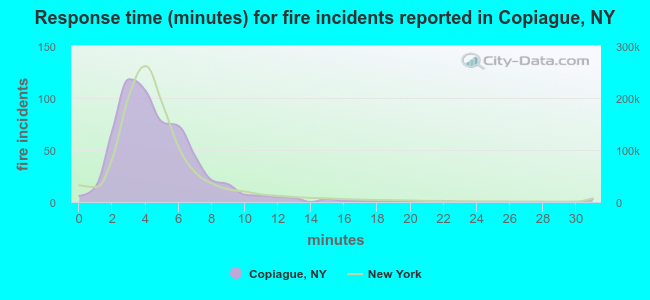 The median response time based on all reported fire incidents is 4 minutes. This is close to the state median value.
The median response time in Copiague, NY compared to nearest cities:
(Note: Based on data for all years, including only cities with at least 500 fire incidents)
| Copiague: | 4 minutes |
| Amityville: | 5 minutes |
| Lindenhurst: | 3 minutes |
| Massapequa: | 6 minutes |
| Wyandanch: | 3 minutes |
| West Islip: | 3 minutes |
| Levittown: | 3 minutes |
| Bay Shore: | 4 minutes |
| Hicksville: | 4 minutes |
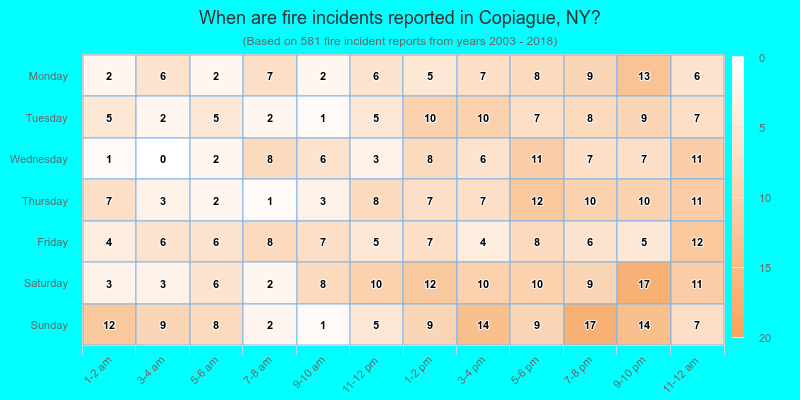
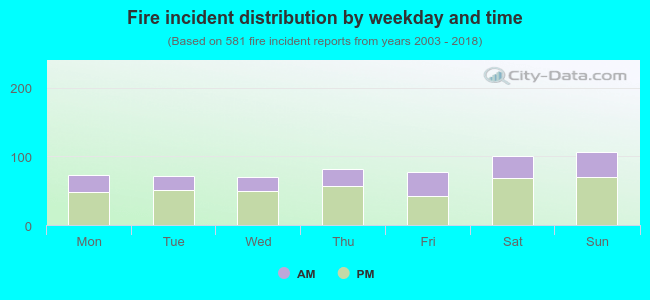 33.4% incidents where reported in the morning and 66.6% in the evening. The most fires (18.4%) took place on Sunday, and the least (12.0%) on Wednesday.
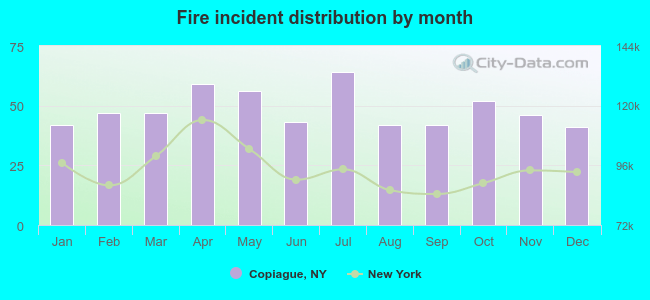 Based on the 581 reports from years 2003 - 2018 most fires (11.0%) took place during July, and the least (7.1%) in December.
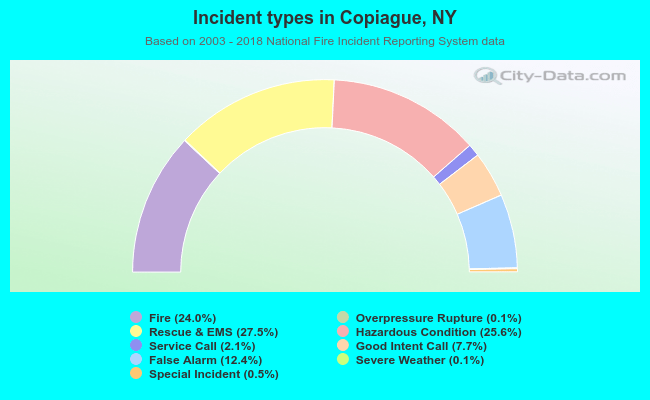 Out of all 2,425 cases reported during the years 2003 - 2018, the most belonged to the categories: Rescue & EMS (27.5%), Hazardous Condition (25.6%), and Fire (24.0%).
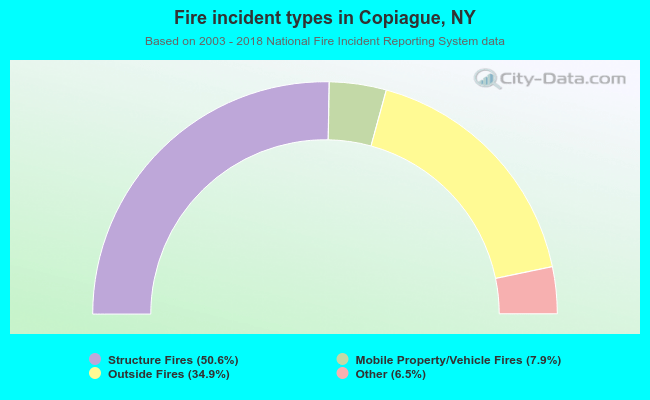 When looking into fire subcategories, the most incidents belonged to: Structure Fires (50.6%), and Outside Fires (34.9%).