Corrales: Fire Incidents, New Mexico (NM)
Where are fire incidents reported in Corrales, NM
Something went wrong! Please refresh the page.
|
| |||||||||||||||||||||||||||||||||||||||||||||||||||||||||||||||||||||||||||||||||||||||||||||||||||||||||||||
2002 - 2018 National Fire Incident Reporting System (NFIRS) incidents
- Incident types reported to NFIRS in Corrales, NM
- 1,58545.1%Rescue & EMS
- 58916.8%Special Incident
- 48313.8%Service Call
- 2888.2%Good Intent Call
- 2567.3%Hazardous Condition
- 2176.2%Fire
- 862.4%False Alarm
- 40.1%Severe Weather
- Fire incident types reported to NFIRS in Corrales, NM
- 11452.5%Outside Fires
- 8036.9%Structure Fires
- 188.3%Mobile Property/Vehicle Fires
- 52.3%Other
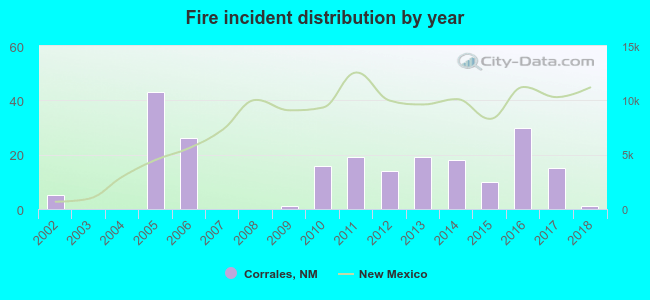 Based on the data from the years 2002 - 2018 the average number of fire incidents per year is 13. The highest number of reported fires - 43 took place in 2005, and the least - 0 in 2003. The data has a declining trend.
The average number of yearly fire incidents per 10k residents in Corrales, NM compared to nearest cities:
(Note: Based on data for the last 3 years, including only cities with population 5,000 and above)
| Corrales: | 18.3 |
| North Valley: | 4.1 |
| Rio Rancho: | 17.1 |
| Bernalillo: | 39.3 |
| Albuquerque: | 25.7 |
| South Valley: | 2.0 |
| Los Lunas: | 192.2 |
| Los Chaves: | 28.8 |
| Belen: | 195.1 |
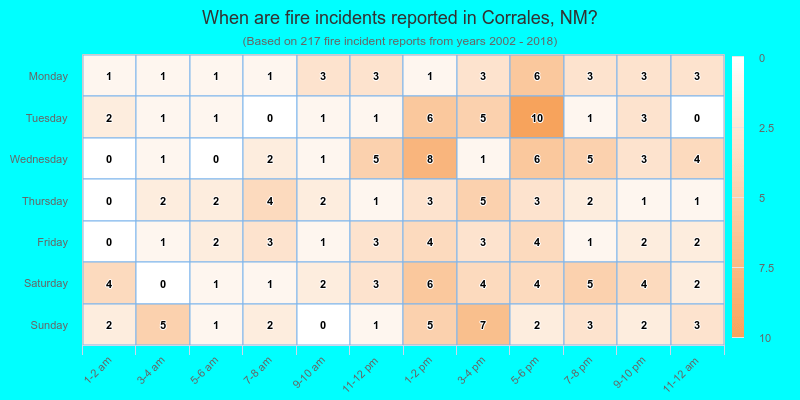
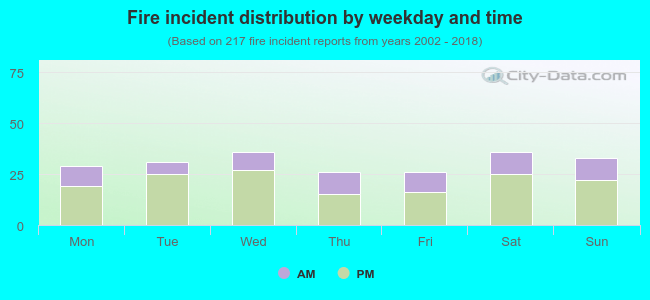 31.3% incidents where reported in the morning and 68.7% in the evening. The most fires (16.6%) took place on Wednesday, and the least (12.0%) on Thursday.
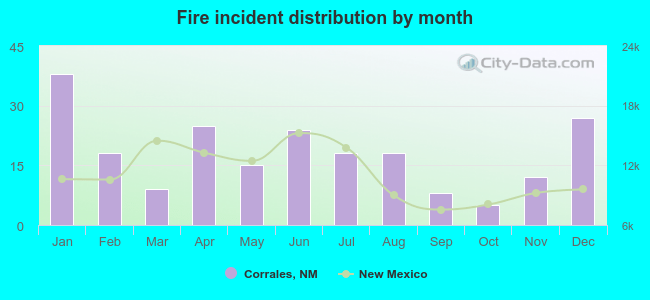 According to the 217 fires from years 2002 - 2018 most fires (17.5%) took place during January, and the least (2.3%) in October.
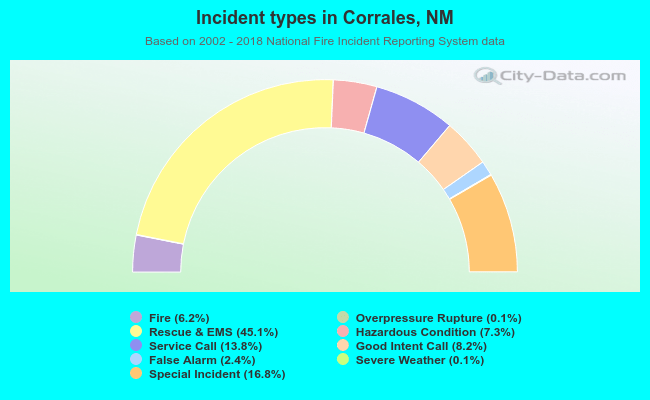 Out of all 3,511 cases reported during the years 2002 - 2018, the most belonged to the categories: Rescue & EMS (45.1%), Special Incident (16.8%), and Service Call (13.8%).
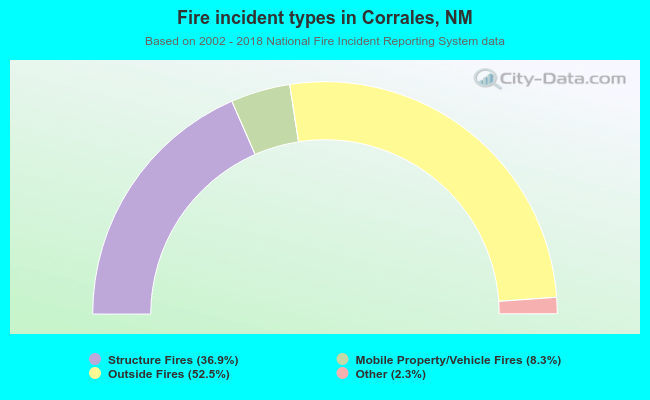 When looking into fire subcategories, the most incidents belonged to: Outside Fires (52.5%), and Structure Fires (36.9%).