Coushatta: Fire Incidents, Louisiana (LA)
Where are fire incidents reported in Coushatta, LA
Something went wrong! Please refresh the page.
|
| |||||||||||||||||||||||||||||||||||||||||||||||||||||||||||||||||||||||||||||||||||||||||||||||||||||||||||||
| Other | 130 | |||||||||||||||||||||||||||||||||||||||||||||||||||||||||||||||||||||||||||||||||||||||||||||||||||||||||||||
2005 - 2018 National Fire Incident Reporting System (NFIRS) incidents
- Incident types reported to NFIRS in Coushatta, LA
- 1,17451.8%Fire
- 29312.9%Good Intent Call
- 28412.5%Hazardous Condition
- 26611.7%Rescue & EMS
- 1416.2%Service Call
- 964.2%False Alarm
- 70.3%Overpressure Rupture
- 50.2%Severe Weather
- Fire incident types reported to NFIRS in Coushatta, LA
- 69759.4%Outside Fires
- 30526.0%Structure Fires
- 14312.2%Mobile Property/Vehicle Fires
- 292.5%Other
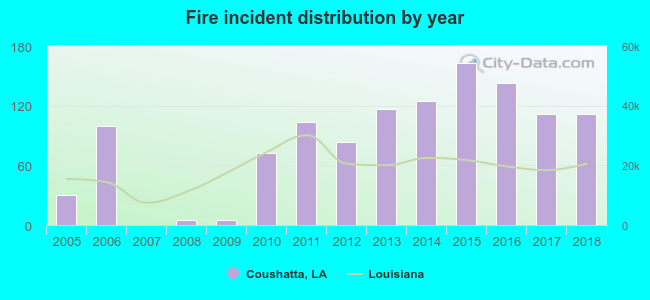 According to the data from the years 2005 - 2018 the average number of fire incidents per year is 84. The highest number of fires - 163 took place in 2015, and the least - 0 in 2007. The data has a growing trend.
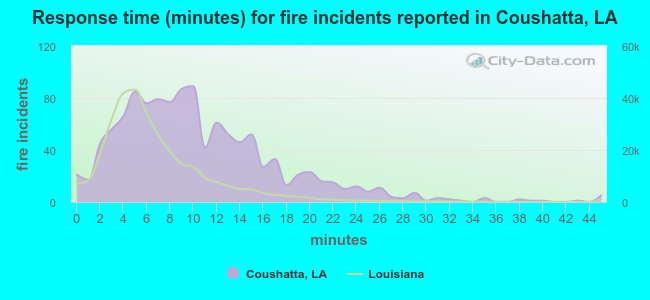 The median response time based on all reported fire incidents is 9 minutes. This is higher than the Louisiana median value.
The median response time in Coushatta, LA compared to nearest cities:
(Note: Based on data for all years, including only cities with at least 500 fire incidents)
| Coushatta: | 9 minutes |
| Campti: | 8 minutes |
| Mansfield: | 6 minutes |
| Ringgold: | 8 minutes |
| Natchitoches: | 5 minutes |
| Haughton: | 6 minutes |
| Shreveport: | 5 minutes |
| Jonesboro: | 3 minutes |
| Bossier City: | 4 minutes |
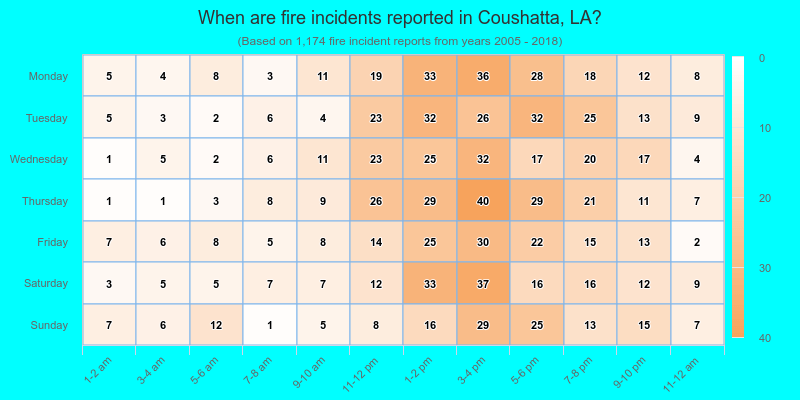
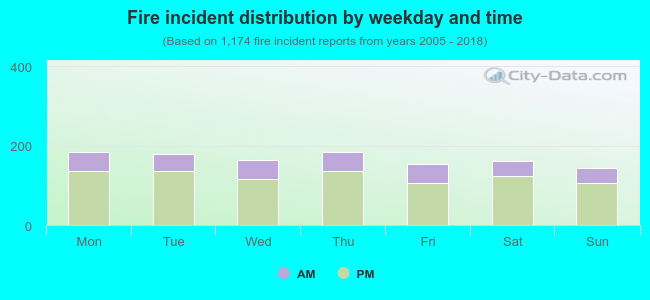 26.8% incidents where reported in the morning and 73.2% in the evening. The most fires (15.8%) took place on Monday, and the least (12.3%) on Sunday.
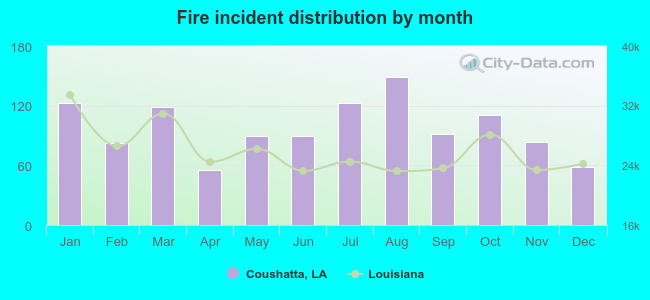 According to the 1,174 fire incident reports from years 2005 - 2018 most fires (12.7%) took place during August, and the least (4.7%) in April.
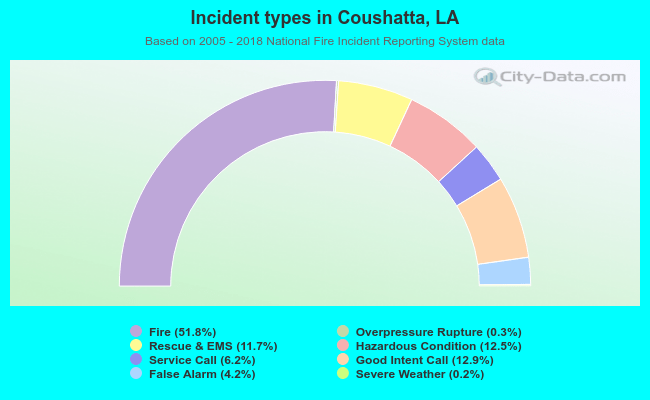 Out of all 2,266 cases reported during the years 2005 - 2018, the most belonged to the categories: Fire (51.8%), Good Intent Call (12.9%), and Hazardous Condition (12.5%).
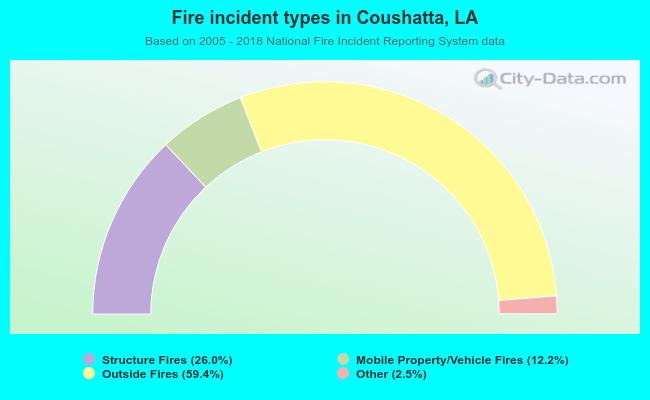 When looking into fire subcategories, the most incidents belonged to: Outside Fires (59.4%), and Structure Fires (26.0%).