Daleville: Fire Incidents, Alabama (AL)
Where are fire incidents reported in Daleville, AL
Something went wrong! Please refresh the page.
|
| |||||||||||||||||||||||||||||||||||||||||||||||||||||||||||||||||||||||||||||||||||||||||||||||||||||||||||||
2004 - 2018 National Fire Incident Reporting System (NFIRS) incidents
- Incident types reported to NFIRS in Daleville, AL
- 40549.1%Fire
- 18822.8%Rescue & EMS
- 16319.8%Hazardous Condition
- 323.9%Good Intent Call
- 182.2%Service Call
- 111.3%False Alarm
- 60.7%Severe Weather
- 20.2%Special Incident
- Fire incident types reported to NFIRS in Daleville, AL
- 18445.4%Outside Fires
- 12931.9%Structure Fires
- 6415.8%Mobile Property/Vehicle Fires
- 286.9%Other
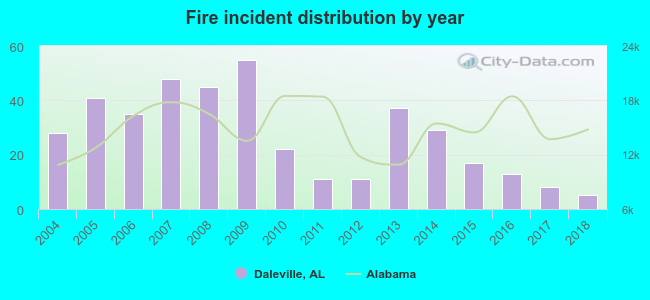 Based on the data from the years 2004 - 2018 the average number of fires per year is 27. The highest number of reported fire incidents - 55 took place in 2009, and the least - 5 in 2018. The data has a decreasing trend.
The average number of yearly fire incidents per 10k residents in Daleville, AL compared to nearest cities:
(Note: Based on data for the last 3 years, including only cities with population 5,000 and above)
| Daleville: | 16.9 |
| Enterprise: | 34.8 |
| Ozark: | 43.5 |
| Dothan: | 47.1 |
| Opp: | 85.9 |
| Troy: | 51.4 |
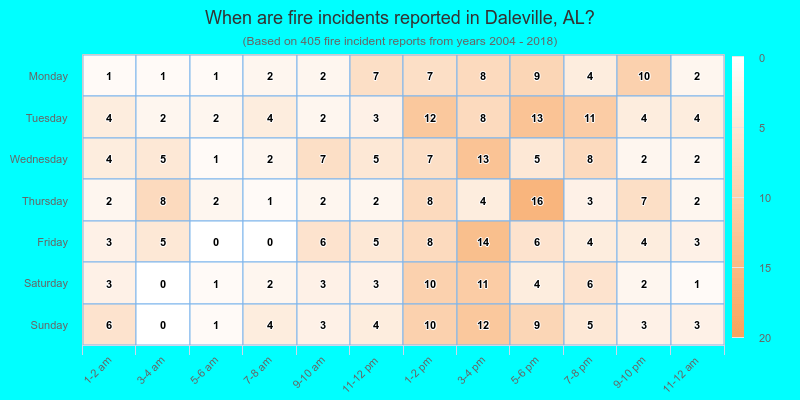
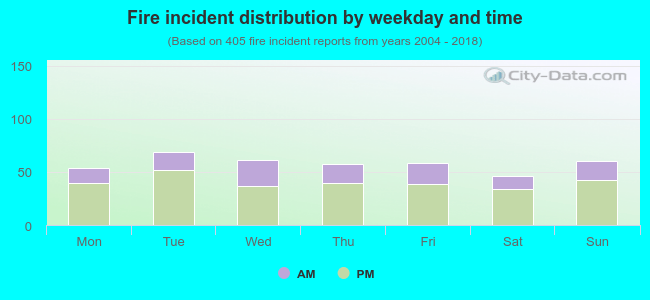 29.9% incidents where reported in the morning and 70.1% in the evening. The most fires (17.0%) took place on Tuesday, and the least (11.4%) on Saturday.
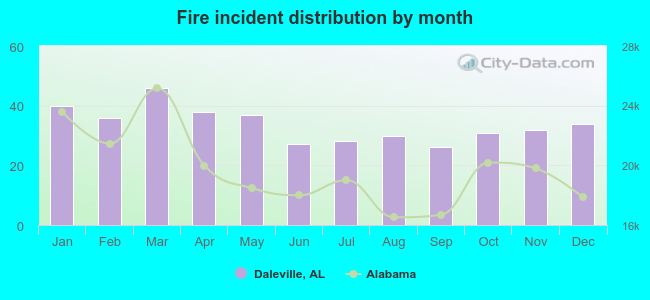 According to the 405 fire incidents from years 2004 - 2018 most fires (11.4%) took place during March, and the least (6.4%) in September.
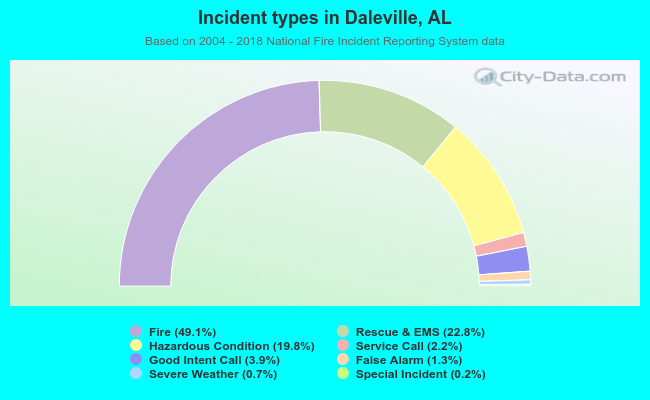 Out of all 825 cases reported during the years 2004 - 2018, the most belonged to the categories: Fire (49.1%), Overpressure Rupture (22.8%), and Rescue & EMS (19.8%).
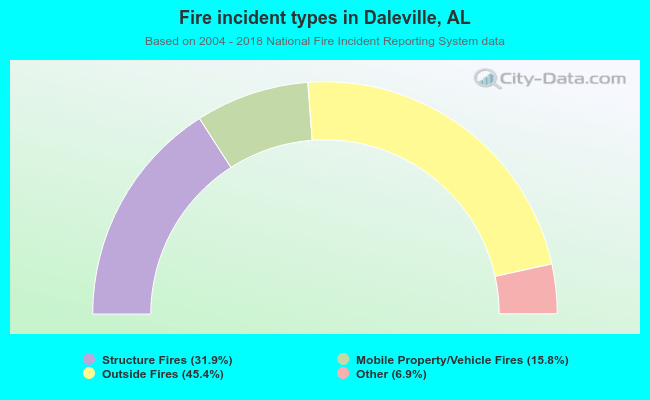 When looking into fire subcategories, the most reports belonged to: Outside Fires (45.4%), and Structure Fires (31.9%).