DeKalb: Fire Incidents, Illinois (IL)
Where are fire incidents reported in DeKalb, IL
Something went wrong! Please refresh the page.
| Fire incidents reported | |
|---|---|
| Sreet name | Count |
| LINCOLN HWY | 418 |
| SYCAMORE RD | 220 |
| RIDGE DR | 176 |
| ANNIE GLIDDEN RD | 166 |
| REGENT DR | 140 |
| HILLCREST DR | 122 |
| RUSSELL RD | 114 |
| 1ST ST | 112 |
| TAYLOR ST | 102 |
| PLEASANT ST | 100 |
| 4TH ST | 86 |
| FOTIS DR | 78 |
| LUCINDA AVE | 74 |
| VARSITY BLVD | 74 |
| SPIROS CT | 72 |
| CRANE DR | 68 |
| DRESSER RD | 62 |
| GREENBRIER RD | 58 |
| 14TH ST | 54 |
| NORMAL RD | 52 |
| KIMBERLY DR | 48 |
| EDGEBROOK DR | 46 |
| HARVESTORE DR | 46 |
| LOCUST ST | 46 |
| 7TH ST | 42 |
| HAISH BLVD | 40 |
| ASPEN CT | 38 |
| OAK ST | 38 |
| BLACKHAWK RD | 34 |
| FAIRVIEW DR | 34 |
2003 - 2018 National Fire Incident Reporting System (NFIRS) incidents
- Incident types reported to NFIRS in DeKalb, IL
- 18,08863.0%Rescue & EMS
- 2,85710.0%Hazardous Condition
- 2,6499.2%Fire
- 2,2187.7%False Alarm
- 1,9876.9%Service Call
- 7892.7%Good Intent Call
- 530.2%Overpressure Rupture
- 500.2%Special Incident
- Fire incident types reported to NFIRS in DeKalb, IL
- 1,25247.3%Structure Fires
- 1,05940.0%Outside Fires
- 29010.9%Mobile Property/Vehicle Fires
- 481.8%Other
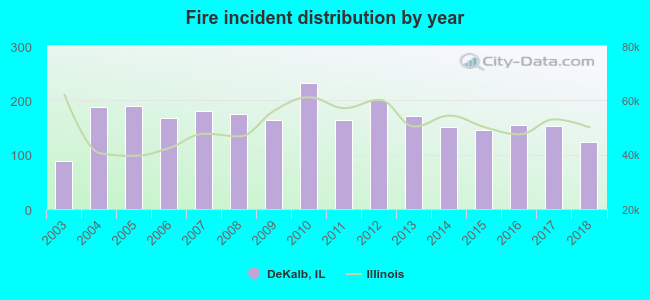 According to the data from the years 2003 - 2018 the average number of fires per year is 165. The highest number of reported fires - 232 took place in 2010, and the least - 89 in 2003. The data has an increasing trend.
The average number of yearly fire incidents per 10k residents in DeKalb, IL compared to nearest cities:
(Note: Based on data for the last 3 years, including only cities with population 5,000 and above)
| DeKalb: | 32.6 |
| Sycamore: | 40.0 |
| Genoa: | 68.9 |
| Elburn: | 84.5 |
| Rochelle: | 65.7 |
| Hampshire: | 84.2 |
| Campton Hills: | 1.3 |
| Sugar Grove: | 41.0 |
| Pingree Grove: | 36.9 |
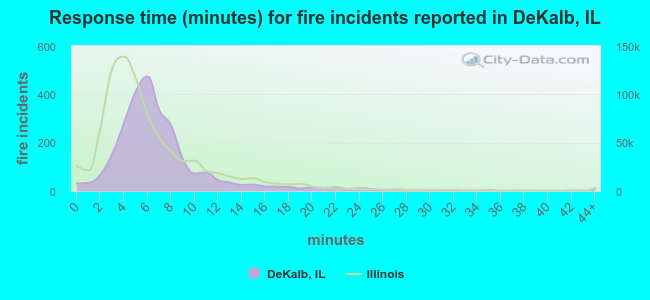 The median response time based on all reported fire incidents is 6 minutes. This is about the same as the Illinois median value.
The median response time in DeKalb, IL compared to nearest cities:
(Note: Based on data for all years, including only cities with at least 500 fire incidents)
| DeKalb: | 6 minutes |
| Sycamore: | 7 minutes |
| Maple Park: | 12 minutes |
| Genoa: | 11 minutes |
| Elburn: | 8 minutes |
| Rochelle: | 7 minutes |
| Hampshire: | 9 minutes |
| Sugar Grove: | 7 minutes |
| Sandwich: | 8 minutes |
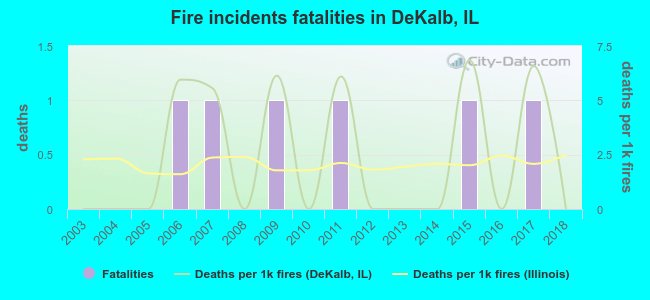 According to the data from the years 2003 - 2018 the average number of fire-related fatalities per year is 0. The highest number of deaths - 1 took place in 2006, and the lowest - 0 in 2003. The data has a constant trend.
The average number of fatalities per 1,000 fires is 2. This indicator was the highest - 7 in 2015, and the lowest 0 in 2003. The trend for deaths per 1,000 fires is constant. Compared to the Illinois value the number of deaths per 1,000 incidents is similar.
According to the data from the years 2003 - 2018 the average number of fire-related fatalities per year is 0. The highest number of deaths - 1 took place in 2006, and the lowest - 0 in 2003. The data has a constant trend.
The average number of fatalities per 1,000 fires is 2. This indicator was the highest - 7 in 2015, and the lowest 0 in 2003. The trend for deaths per 1,000 fires is constant. Compared to the Illinois value the number of deaths per 1,000 incidents is similar.
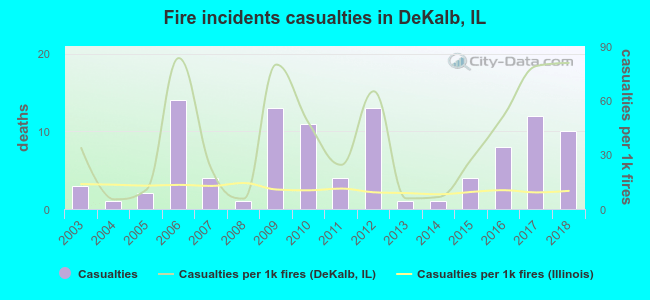 According to the data from the years 2003 - 2018 the average number of fire-related casualties per year is 6. The highest number of casualties - 14 took place in 2006, and the lowest - 1 in 2004. The data has a rising trend.
The average number of injuries per 1,000 fires is 39. This indicator was the highest - 83 in 2006, and the lowest 5 in 2004. The trend for injuries per 1,000 incidents is increasing. Compared to the state value the number of casualties per 1,000 fires is much higher.
According to the data from the years 2003 - 2018 the average number of fire-related casualties per year is 6. The highest number of casualties - 14 took place in 2006, and the lowest - 1 in 2004. The data has a rising trend.
The average number of injuries per 1,000 fires is 39. This indicator was the highest - 83 in 2006, and the lowest 5 in 2004. The trend for injuries per 1,000 incidents is increasing. Compared to the state value the number of casualties per 1,000 fires is much higher.Casualties per 1,000 incidents in DeKalb, IL compared to nearest cities:
(Note: Based on data for all years, including only cities with at least 500 fire incidents)
| DeKalb: | 38.5 |
| Sycamore: | 10.1 |
| Maple Park: | 1.7 |
| Genoa: | 1.8 |
| Elburn: | 1.0 |
| Rochelle: | 11.9 |
| Hampshire: | 6.7 |
| Sugar Grove: | 4.3 |
| Sandwich: | 7.9 |
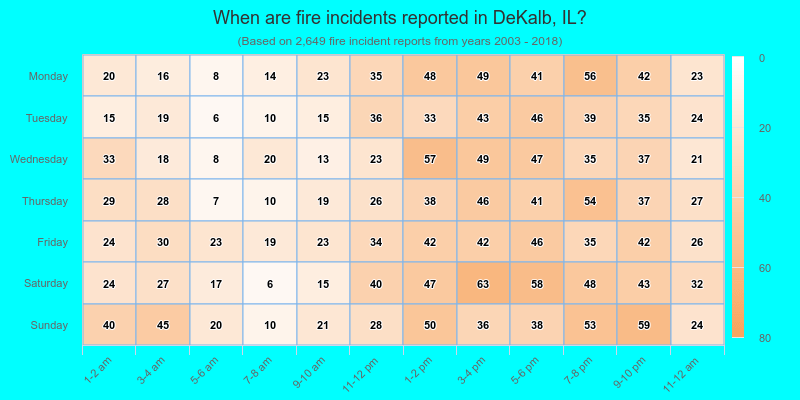
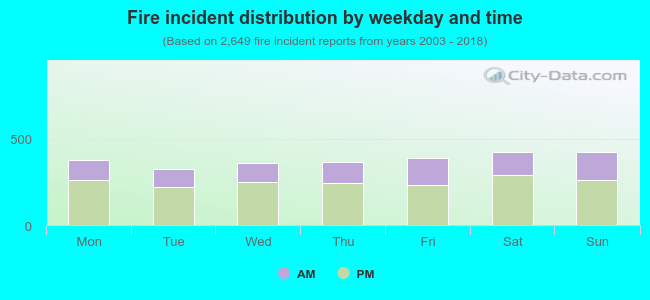 33.9% incidents where reported in the morning and 66.1% in the evening. The most fires (16.0%) took place on Sunday, and the least (12.1%) on Tuesday.
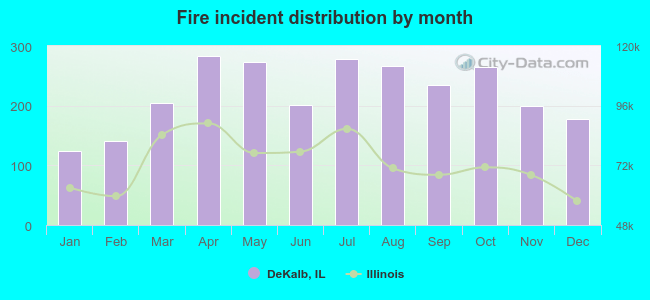 According to the 2,649 fire incident reports from years 2003 - 2018 most fires (10.7%) took place during April, and the least (4.7%) in January.
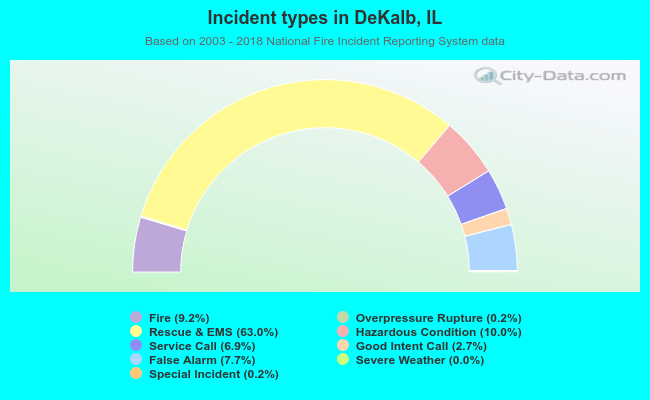 Out of all 28,701 cases reported during the years 2003 - 2018, the most belonged to the categories: Rescue & EMS (63.0%), Hazardous Condition (10.0%), and Fire (9.2%).
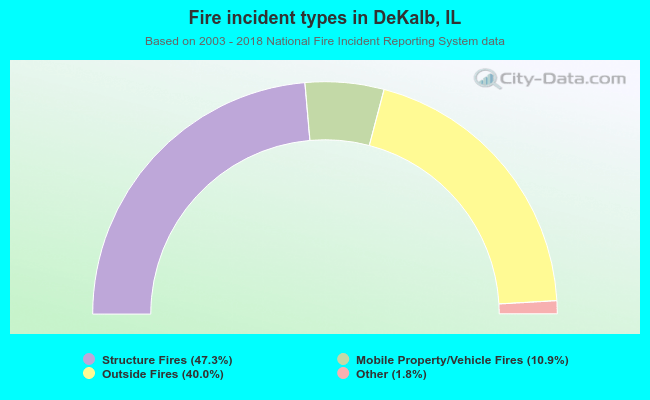 When looking into fire subcategories, the most reports belonged to: Structure Fires (47.3%), and Outside Fires (40.0%).