Denham Springs: Fire Incidents, Louisiana (LA)
Where are fire incidents reported in Denham Springs, LA
Something went wrong! Please refresh the page.
| Fire incidents reported | |
|---|---|
| Sreet name | Count |
| HWY 16 | 366 |
| 16 N HWY | 218 |
| VINCENT RD | 206 |
| FLORIDA BLVD | 196 |
| LOCKHART RD | 152 |
| RANGE AVE | 152 |
| ARNOLD RD | 146 |
| 16 S HWY | 136 |
| JUBAN RD | 134 |
| LINDER RD | 132 |
| WALKER RD | 132 |
| SPRINGFIELD RD | 116 |
| BROWN RD | 108 |
| SUSIE CIRCLE | 106 |
| FLORIDA AVE | 104 |
| BUDDY ELLIS RD | 94 |
| MAGNOLIA BEACH RD | 94 |
| EASTOVER BLVD | 84 |
| EDEN CHURCH RD | 80 |
| BURGESS RD | 70 |
| CANE MARKET RD | 70 |
| CHOCTAW | 70 |
| OLD RIVER RD | 66 |
| JOE MAY RD | 64 |
| COCKERHAM RD | 62 |
| RUSHING RD | 62 |
| CLINTON ALLEN RD | 60 |
| DUNN RD | 60 |
| PINE BLUFF RD | 50 |
| 4H CLUB RD | 46 |
| Other | 2,114 |
2002 - 2018 National Fire Incident Reporting System (NFIRS) incidents
- Incident types reported to NFIRS in Denham Springs, LA
- 18,81454.9%Rescue & EMS
- 5,55016.2%Fire
- 4,36912.8%Good Intent Call
- 2,1346.2%Service Call
- 1,6934.9%Hazardous Condition
- 1,6204.7%False Alarm
- Fire incident types reported to NFIRS in Denham Springs, LA
- 3,22358.1%Outside Fires
- 1,56328.2%Structure Fires
- 66311.9%Mobile Property/Vehicle Fires
- 1011.8%Other
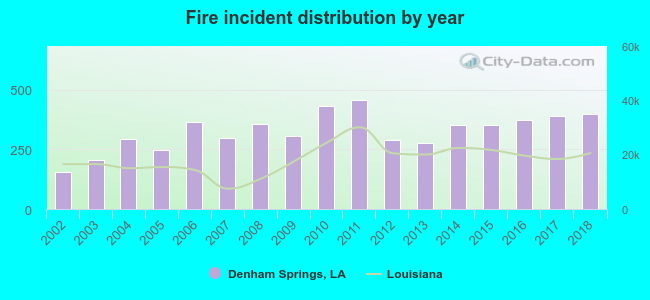 Based on the data from the years 2002 - 2018 the average number of fires per year is 326. The highest number of reported fire incidents - 456 took place in 2011, and the least - 156 in 2002. The data has a growing trend.
The average number of yearly fire incidents per 10k residents in Denham Springs, LA compared to nearest cities:
(Note: Based on data for the last 3 years, including only cities with population 5,000 and above)
| Denham Springs: | 383.0 |
| Walker: | 191.8 |
| Monticello: | 1.9 |
| Baton Rouge: | 60.1 |
| Prairieville: | 53.8 |
| Baker: | 59.3 |
| Port Allen: | 77.8 |
| Zachary: | 82.4 |
| Gonzales: | 132.3 |
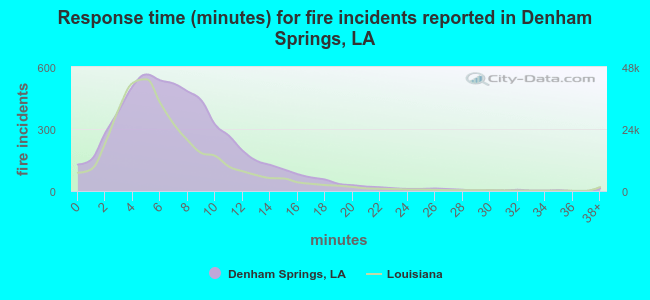 The median response time based on all reported fire incidents is 7 minutes. This is comparable to the Louisiana median value.
The median response time in Denham Springs, LA compared to nearest cities:
(Note: Based on data for all years, including only cities with at least 500 fire incidents)
| Denham Springs: | 7 minutes |
| Walker: | 8 minutes |
| Baton Rouge: | 4 minutes |
| Prairieville: | 6 minutes |
| Livingston: | 9 minutes |
| Baker: | 5 minutes |
| Port Allen: | 5 minutes |
| Zachary: | 6 minutes |
| Gonzales: | 6 minutes |
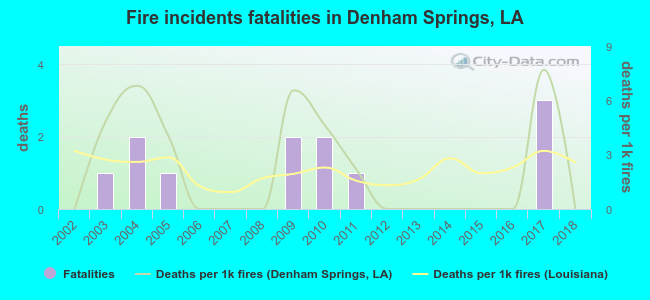 According to the reports from the years 2002 - 2018 the average number of fire-related yearly deaths is 1. The highest number of deaths - 3 took place in 2017, and the lowest - 0 in 2002. The data has a constant trend.
The average number of deaths per 1,000 fires is 2. This indicator was the highest - 8 in 2017, and the lowest 0 in 2002. The trend for fatalities per 1,000 fire incidents is constant. Compared to the Louisiana value the number of fatalities per 1,000 fires is about the same.
According to the reports from the years 2002 - 2018 the average number of fire-related yearly deaths is 1. The highest number of deaths - 3 took place in 2017, and the lowest - 0 in 2002. The data has a constant trend.
The average number of deaths per 1,000 fires is 2. This indicator was the highest - 8 in 2017, and the lowest 0 in 2002. The trend for fatalities per 1,000 fire incidents is constant. Compared to the Louisiana value the number of fatalities per 1,000 fires is about the same.Deaths per 1,000 incidents in Denham Springs, LA compared to nearest cities:
(Note: Based on data for all years, including only cities with at least 2,500 fire incidents)
| Denham Springs: | 2.2 |
| Baton Rouge: | 2.1 |
| Hammond: | 1.4 |
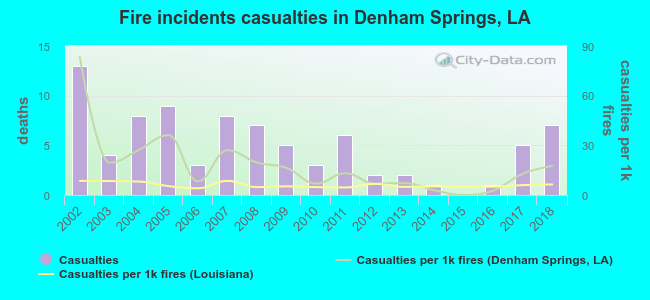 Based on the data from the years 2002 - 2018 the average number of fire-related yearly casualties is 5. The highest number of injuries - 13 took place in 2002, and the lowest - 0 in 2015. The data has a dropping trend.
The average number of injuries per 1,000 fires is 18. This indicator was the highest - 83 in 2002, and the lowest 0 in 2015. The trend for casualties per 1,000 fire incidents is dropping. Compared to the Louisiana value the number of injuries per 1,000 incidents is much higher.
Based on the data from the years 2002 - 2018 the average number of fire-related yearly casualties is 5. The highest number of injuries - 13 took place in 2002, and the lowest - 0 in 2015. The data has a dropping trend.
The average number of injuries per 1,000 fires is 18. This indicator was the highest - 83 in 2002, and the lowest 0 in 2015. The trend for casualties per 1,000 fire incidents is dropping. Compared to the Louisiana value the number of injuries per 1,000 incidents is much higher.Casualties per 1,000 incidents in Denham Springs, LA compared to nearest cities:
(Note: Based on data for all years, including only cities with at least 500 fire incidents)
| Denham Springs: | 15.1 |
| Walker: | 6.4 |
| Baton Rouge: | 6.4 |
| Prairieville: | 3.1 |
| Livingston: | 1.5 |
| Baker: | 9.0 |
| Port Allen: | 21.7 |
| Zachary: | 7.7 |
| Gonzales: | 2.3 |
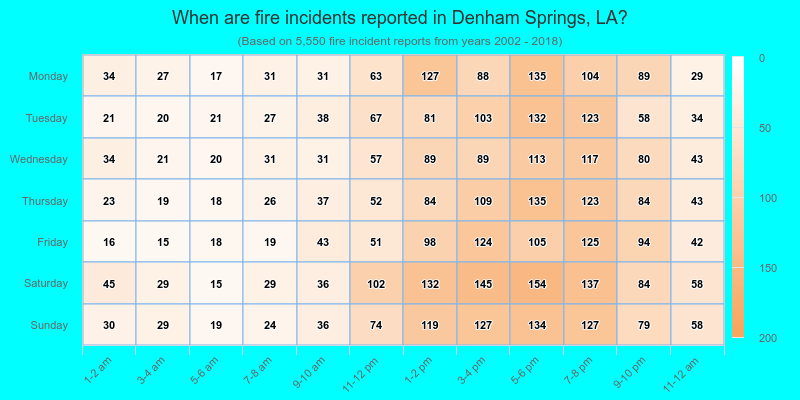
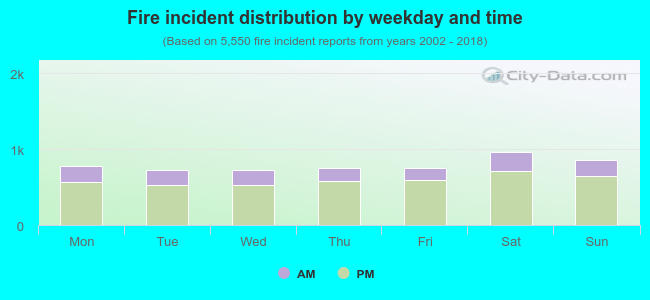 25.2% incidents where reported in the morning and 74.8% in the evening. The most fires (17.4%) took place on Saturday, and the least (13.1%) on Tuesday.
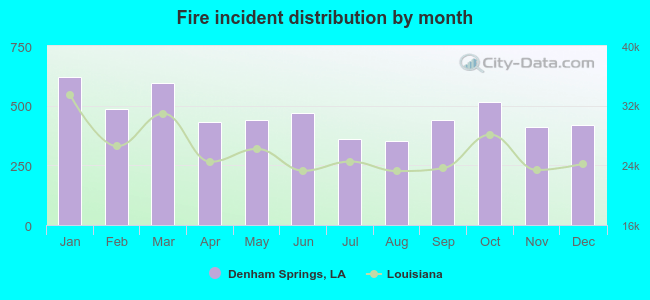 According to the 5,550 fire incident reports from years 2002 - 2018 most fires (11.2%) took place during January, and the least (6.4%) in August.
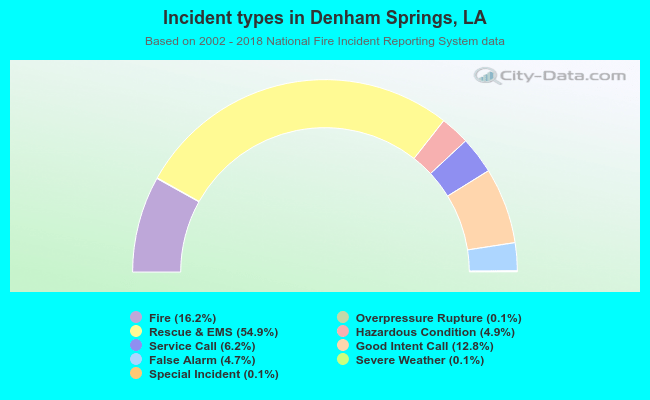 Out of all 34,260 cases reported during the years 2002 - 2018, the most belonged to the categories: Rescue & EMS (54.9%), Fire (16.2%), and Good Intent Call (12.8%).
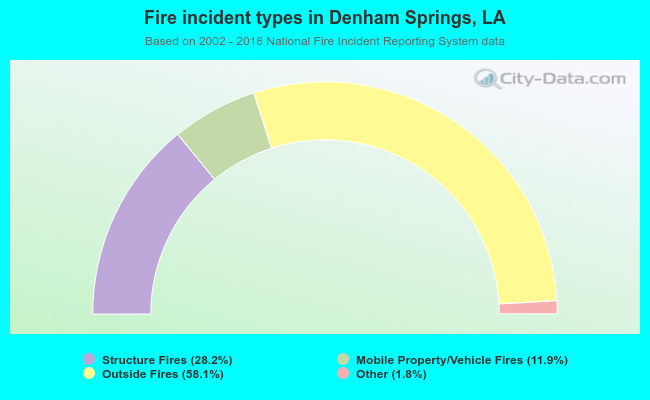 When looking into fire subcategories, the most reports belonged to: Outside Fires (58.1%), and Structure Fires (28.2%).