Derry: Fire Incidents, New Hampshire (NH)
Where are fire incidents reported in Derry, NH
Something went wrong! Please refresh the page.
| Fire incidents reported | |
|---|---|
| Sreet name | Count |
| CRYSTAL AVE | 190 |
| FAIRWAYS DR | 118 |
| ISLAND POND RD | 96 |
| MANCHESTER RD | 94 |
| LINLEW DR | 88 |
| ROCKINGHAM RD | 78 |
| EAST BROADWAY | 68 |
| TSIENNETO RD | 60 |
| WEST BROADWAY | 56 |
| CHESTER RD | 54 |
| MUTUAL AID | 50 |
| FAIRWAY DR | 46 |
| BIRCH ST | 44 |
| NORTH MAIN ST | 44 |
| FORDWAY EXT | 38 |
| KENDALL POND RD | 36 |
| PIERCE AVE | 36 |
| SCENIC DR | 36 |
| DERRY WAY | 34 |
| BYPASS 28 | 32 |
| DERRYFIELD RD | 30 |
| LARAWAY CT | 30 |
| HAMPSTEAD RD | 28 |
| KILREA RD | 28 |
| PEMBROKE DR | 28 |
| WARNER HILL RD | 28 |
| DREW RD | 26 |
| NORTH SHORE RD | 26 |
| RT 93 | 26 |
| SOUTH AVE | 26 |
| Other | 328 |
2002 - 2018 National Fire Incident Reporting System (NFIRS) incidents
- Incident types reported to NFIRS in Derry, NH
- 12,12751.6%Rescue & EMS
- 3,37914.4%Service Call
- 2,3199.9%Hazardous Condition
- 2,1979.4%False Alarm
- 1,9028.1%Fire
- 1,4616.2%Good Intent Call
- 370.2%Severe Weather
- 360.2%Overpressure Rupture
- 310.1%Special Incident
- Fire incident types reported to NFIRS in Derry, NH
- 88946.7%Structure Fires
- 74539.2%Outside Fires
- 20710.9%Mobile Property/Vehicle Fires
- 613.2%Other
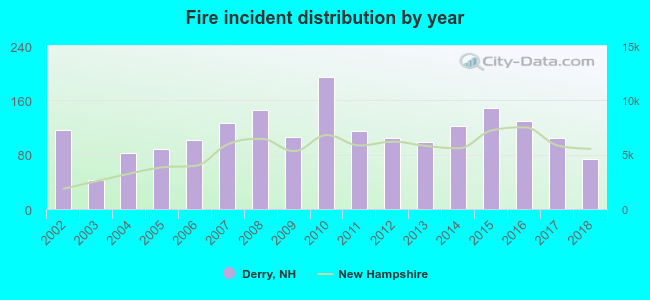 According to the data from the years 2002 - 2018 the average number of fire incidents per year is 112. The highest number of fire incidents - 194 took place in 2010, and the least - 42 in 2003. The data has a declining trend.
The average number of yearly fire incidents per 10k residents in Derry, NH compared to nearest cities:
(Note: Based on data for the last 3 years, including only cities with population 5,000 and above)
| Derry: | 46.6 |
| Londonderry: | 72.8 |
| Windham: | 29.7 |
| Hampstead: | 26.2 |
| Sandown: | 25.1 |
| Litchfield: | 33.5 |
| Salem: | 38.0 |
| Atkinson: | 17.3 |
| Manchester: | 27.2 |
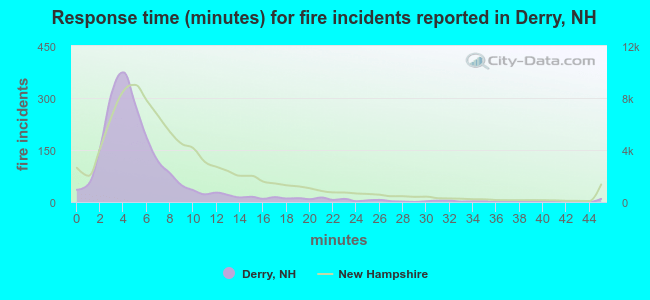 The median response time based on all reported fire incidents is 5 minutes. This is lower than the New Hampshire median value.
The median response time in Derry, NH compared to nearest cities:
(Note: Based on data for all years, including only cities with at least 500 fire incidents)
| Derry: | 5 minutes |
| Londonderry: | 6 minutes |
| Windham: | 9 minutes |
| Salem: | 5 minutes |
| Manchester: | 5 minutes |
| Pelham: | 8 minutes |
| Merrimack: | 6 minutes |
| Hudson: | 6 minutes |
| Bedford: | 7 minutes |
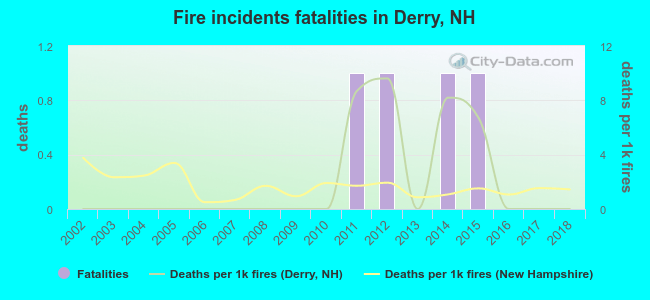 According to the reports from the years 2002 - 2018 the average number of fire-related fatalities per year is 0. The highest number of deaths - 1 took place in 2011, and the lowest - 0 in 2002. The data has a constant trend.
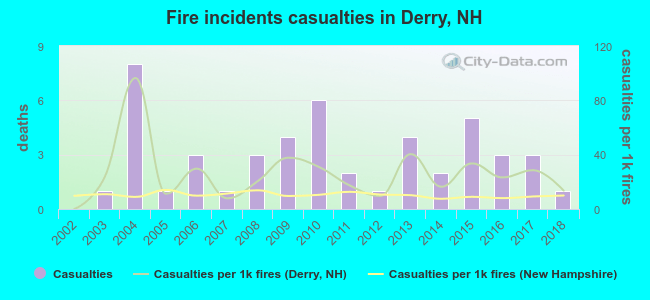 Based on the reports from the years 2002 - 2018 the average number of fire-related yearly casualties is 3. The highest number of injuries - 8 took place in 2004, and the lowest - 0 in 2002. The data has a rising trend.
The average number of injuries per 1,000 fire incidents is 26. This indicator was the highest - 96 in 2004, and the lowest 0 in 2002. The trend for injuries per 1,000 incidents is increasing. Compared to the state value the number of casualties per 1,000 incidents is much higher.
Based on the reports from the years 2002 - 2018 the average number of fire-related yearly casualties is 3. The highest number of injuries - 8 took place in 2004, and the lowest - 0 in 2002. The data has a rising trend.
The average number of injuries per 1,000 fire incidents is 26. This indicator was the highest - 96 in 2004, and the lowest 0 in 2002. The trend for injuries per 1,000 incidents is increasing. Compared to the state value the number of casualties per 1,000 incidents is much higher.Casualties per 1,000 incidents in Derry, NH compared to nearest cities:
(Note: Based on data for all years, including only cities with at least 500 fire incidents)
| Derry: | 25.2 |
| Londonderry: | 7.7 |
| Windham: | 11.0 |
| Salem: | 23.5 |
| Manchester: | 22.6 |
| Pelham: | 17.6 |
| Merrimack: | 37.1 |
| Hudson: | 19.3 |
| Bedford: | 11.3 |
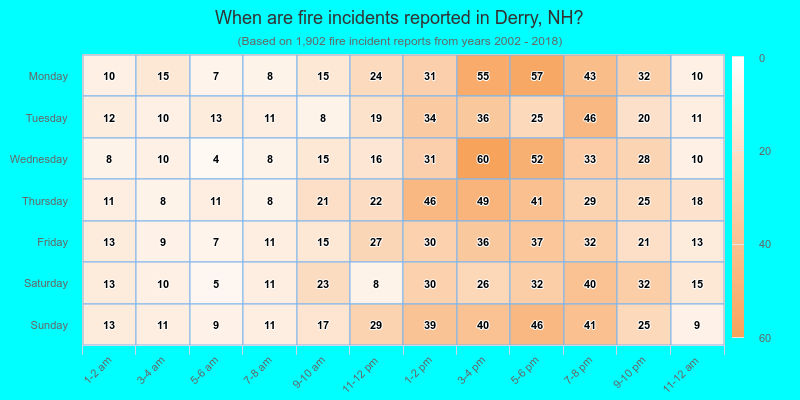
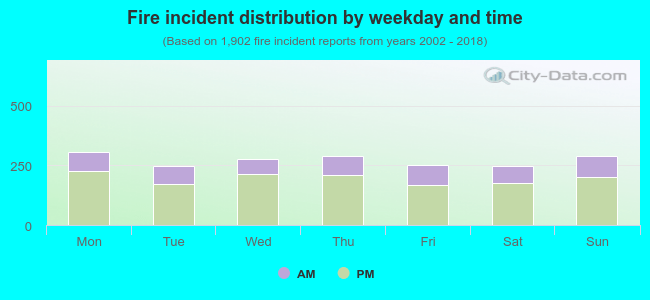 28.2% incidents where reported in the morning and 71.8% in the evening. The most fires (16.1%) took place on Monday, and the least (12.9%) on Tuesday.
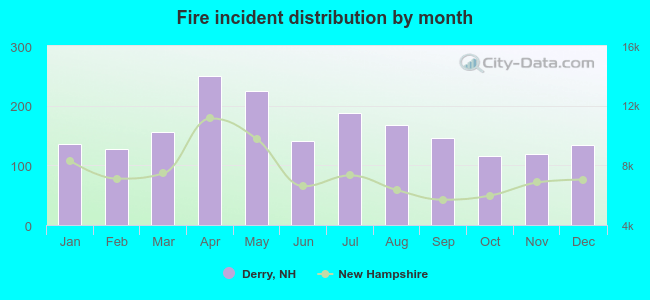 According to the 1,902 fire incidents from years 2002 - 2018 most fires (13.1%) took place during April, and the least (6.0%) in October.
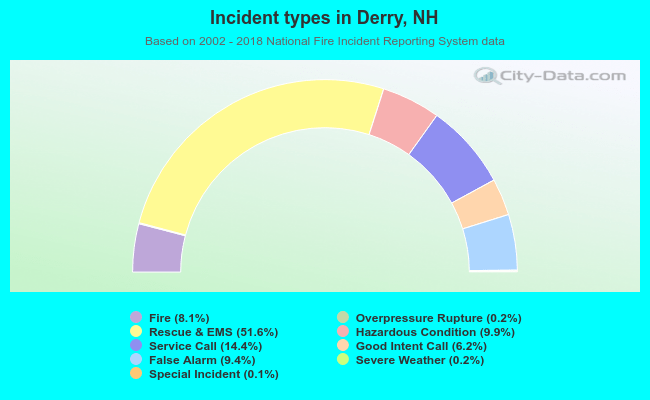 Out of all 23,489 cases reported during the years 2002 - 2018, the most belonged to the categories: Rescue & EMS (51.6%), Service Call (14.4%), and Hazardous Condition (9.9%).
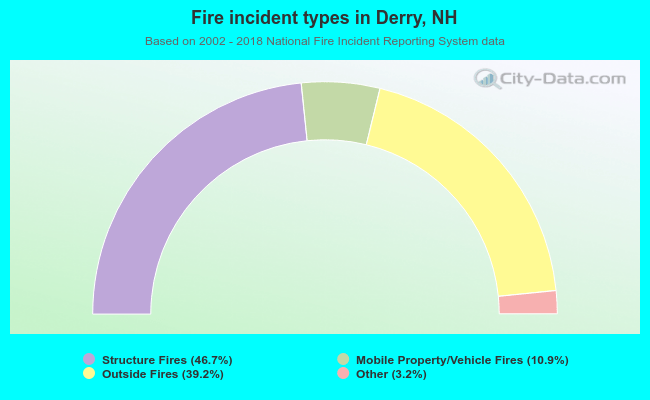 When looking into fire subcategories, the most reports belonged to: Structure Fires (46.7%), and Outside Fires (39.2%).