Dillon: Fire Incidents, Montana (MT)
Where are fire incidents reported in Dillon, MT
Something went wrong! Please refresh the page.
|
| |||||||||||||||||||||||||||||||||||||||||||||||||||||||||||||||||||||||||||||||||||||||||||||||||||||||||||||
| Other | 47 | |||||||||||||||||||||||||||||||||||||||||||||||||||||||||||||||||||||||||||||||||||||||||||||||||||||||||||||
2002 - 2018 National Fire Incident Reporting System (NFIRS) incidents
- Incident types reported to NFIRS in Dillon, MT
- 47945.7%Fire
- 29928.5%Hazardous Condition
- 15514.8%Good Intent Call
- 797.5%Rescue & EMS
- 242.3%False Alarm
- 131.2%Service Call
- Fire incident types reported to NFIRS in Dillon, MT
- 25453.0%Outside Fires
- 11824.6%Structure Fires
- 7114.8%Mobile Property/Vehicle Fires
- 367.5%Other
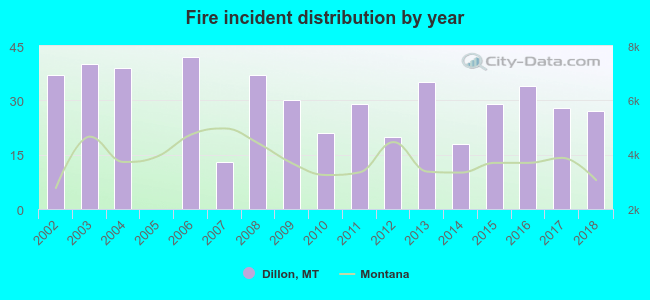 Based on the data from the years 2002 - 2018 the average number of fire incidents per year is 28. The highest number of reported fires - 42 took place in 2006, and the least - 0 in 2005. The data has a decreasing trend.
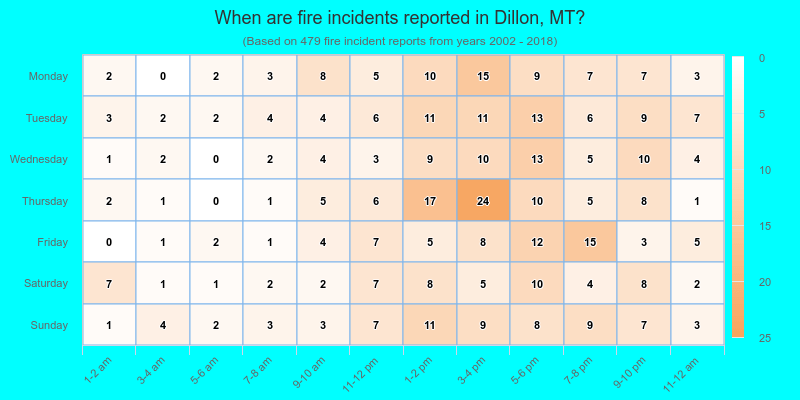
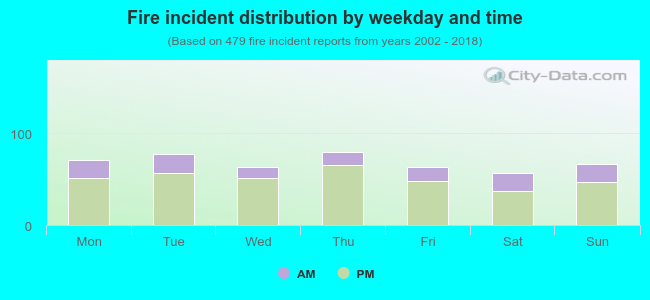 25.7% incidents where reported in the morning and 74.3% in the evening. The most fires (16.7%) took place on Thursday, and the least (11.9%) on Saturday.
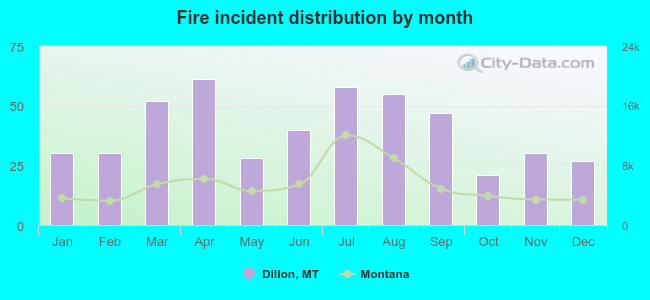 Based on the 479 reports from years 2002 - 2018 most fires (12.7%) took place during April, and the least (4.4%) in October.
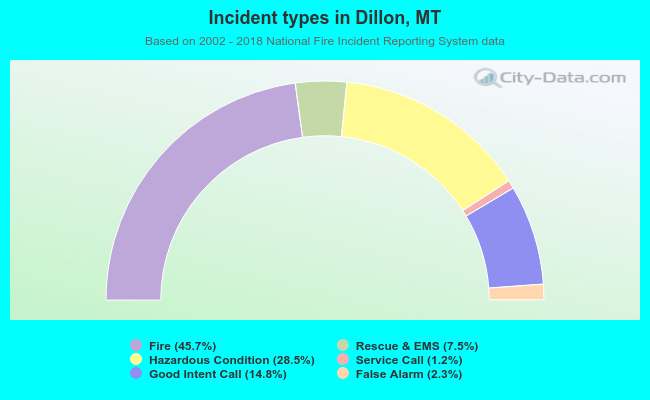 Out of all 1,049 cases reported during the years 2002 - 2018, the most belonged to the categories: Fire (45.7%), Rescue & EMS (28.5%), and Service Call (14.8%).
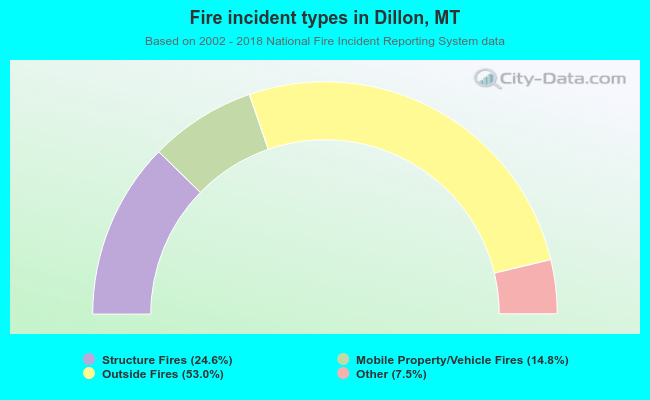 When looking into fire subcategories, the most reports belonged to: Outside Fires (53.0%), and Structure Fires (24.6%).