Dover: Fire Incidents, Ohio (OH)
Where are fire incidents reported in Dover, OH
Something went wrong! Please refresh the page.
| Fire incidents reported | |
|---|---|
| Sreet name | Count |
| TUSCARAWAS AVE | 120 |
| WOOSTER AVE | 106 |
| 3RD ST | 66 |
| STATE ROUTE 39 | 62 |
| 4TH ST | 52 |
| SCHNEIDERS CROSSING RD | 52 |
| DAVIS RD | 40 |
| RACE ST | 36 |
| BOULEVARD | 34 |
| 5TH ST | 32 |
| CRATER AVE | 32 |
| CROSS ST | 32 |
| DOVER-ZOAR RD | 32 |
| OXFORD ST | 32 |
| STATE ROUTE 516 | 32 |
| STATE ROUTE 800 | 32 |
| FRONT ST | 30 |
| IRON AVE | 28 |
| OHIO AVE | 28 |
| UNION AVE | 28 |
| BLACKSNAKE HILL RD | 26 |
| COLUMBIA RD | 26 |
| WALNUT ST | 26 |
| 2ND ST | 24 |
| DOVER AVE | 24 |
| CROOKED RUN RD | 22 |
| 7TH ST | 20 |
| WASHINGTON ST | 20 |
| 8TH ST | 18 |
| BOYSCOUT RD | 18 |
| Other | 207 |
2002 - 2018 National Fire Incident Reporting System (NFIRS) incidents
- Incident types reported to NFIRS in Dover, OH
- 7,45356.7%Rescue & EMS
- 1,44111.0%Service Call
- 1,33710.2%Fire
- 1,2949.8%Hazardous Condition
- 1,0718.1%Good Intent Call
- 4653.5%False Alarm
- 510.4%Severe Weather
- 260.2%Special Incident
- 160.1%Overpressure Rupture
- Fire incident types reported to NFIRS in Dover, OH
- 70552.7%Structure Fires
- 39229.3%Outside Fires
- 23217.4%Mobile Property/Vehicle Fires
- 80.6%Other
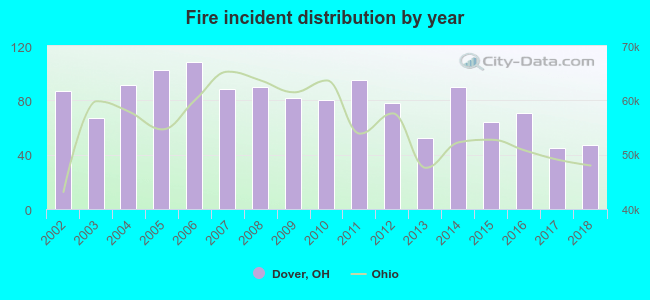 According to the data from the years 2002 - 2018 the average number of fire incidents per year is 79. The highest number of reported fires - 108 took place in 2006, and the least - 45 in 2017. The data has a declining trend.
The average number of yearly fire incidents per 10k residents in Dover, OH compared to nearest cities:
(Note: Based on data for the last 3 years, including only cities with population 5,000 and above)
| Dover: | 42.3 |
| New Philadelphia: | 37.1 |
| Uhrichsville: | 115.4 |
| Massillon: | 27.6 |
| Canton: | 54.2 |
| Louisville: | 68.5 |
| North Canton: | 32.2 |
| Canal Fulton: | 32.8 |
| Orrville: | 74.5 |
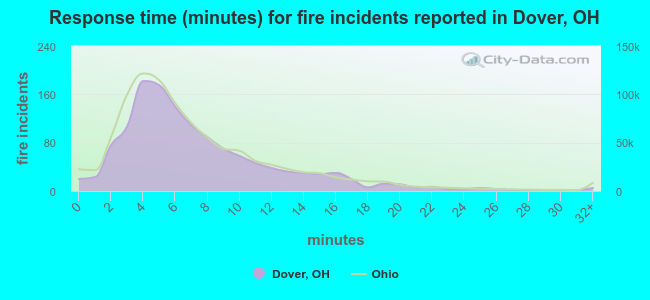 The median response time based on all reported fire incidents is 6 minutes. This is about the same as the Ohio median value.
The median response time in Dover, OH compared to nearest cities:
(Note: Based on data for all years, including only cities with at least 500 fire incidents)
| Dover: | 6 minutes |
| New Philadelphia: | 6 minutes |
| Sugarcreek: | 11 minutes |
| Uhrichsville: | 6 minutes |
| Navarre: | 10 minutes |
| Newcomerstown: | 11 minutes |
| Massillon: | 5 minutes |
| Canton: | 5 minutes |
| East Canton: | 10 minutes |
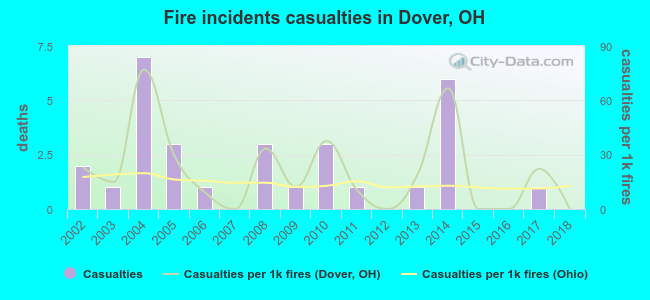 Based on the reports from the years 2002 - 2018 the average number of fire-related yearly casualties is 2. The highest number of casualties - 7 took place in 2004, and the lowest - 0 in 2007. The data has a decreasing trend.
The average number of casualties per 1,000 fire incidents is 21. This indicator was the highest - 77 in 2004, and the lowest 0 in 2007. The trend for injuries per 1,000 incidents is decreasing. Compared to the state value the number of injuries per 1,000 fire incidents is higher.
Based on the reports from the years 2002 - 2018 the average number of fire-related yearly casualties is 2. The highest number of casualties - 7 took place in 2004, and the lowest - 0 in 2007. The data has a decreasing trend.
The average number of casualties per 1,000 fire incidents is 21. This indicator was the highest - 77 in 2004, and the lowest 0 in 2007. The trend for injuries per 1,000 incidents is decreasing. Compared to the state value the number of injuries per 1,000 fire incidents is higher.Casualties per 1,000 incidents in Dover, OH compared to nearest cities:
(Note: Based on data for all years, including only cities with at least 500 fire incidents)
| Dover: | 22.4 |
| New Philadelphia: | 2.3 |
| Sugarcreek: | 5.7 |
| Uhrichsville: | 11.8 |
| Navarre: | 9.2 |
| Newcomerstown: | 2.4 |
| Massillon: | 13.5 |
| Canton: | 23.7 |
| East Canton: | 14.8 |
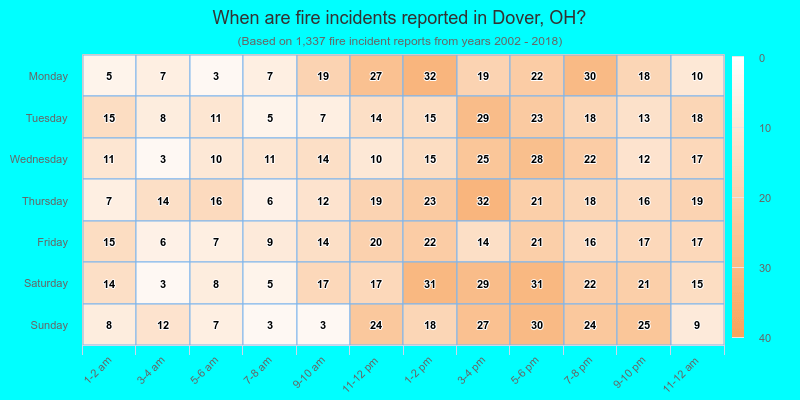
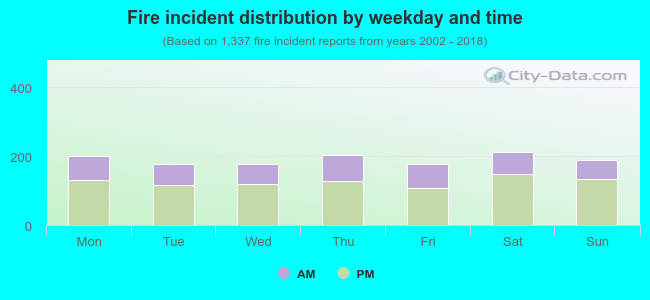 33.9% incidents where reported in the morning and 66.1% in the evening. The most fires (15.9%) took place on Saturday, and the least (13.2%) on Tuesday.
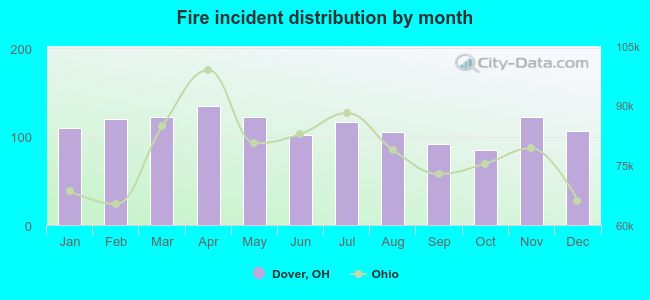 Based on the 1,337 fires from years 2002 - 2018 most fires (10.1%) took place during April, and the least (6.4%) in October.
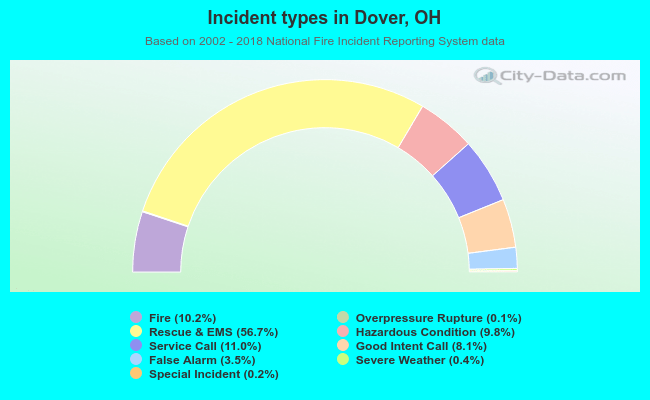 Out of all 13,154 cases reported during the years 2002 - 2018, the most belonged to the categories: Rescue & EMS (56.7%), Service Call (11.0%), and Fire (10.2%).
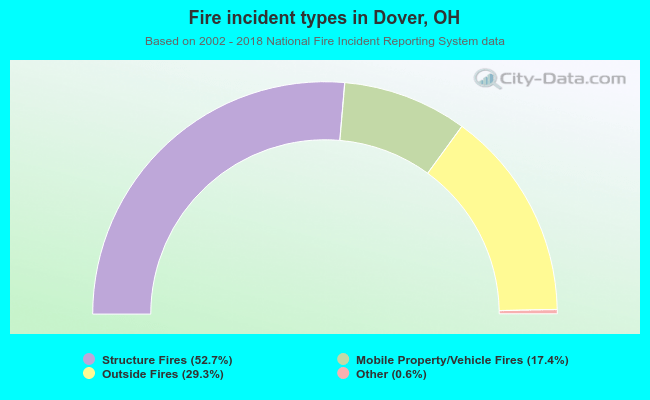 When looking into fire subcategories, the most incidents belonged to: Structure Fires (52.7%), and Outside Fires (29.3%).