| Fire incidents reported |
|---|
| Sreet name | Count |
|---|
| HWY 163 | 28 | | HWY 527 | 28 | | DEMENT RD | 18 | | HORSESHOE BEND RD | 16 | | PILGRIMS REST RD | 16 | | AMOS CUT OFF RD | 10 | | AMOS CUTOFF | 10 | | CLARK CIR | 10 | | HIGHWAY 163 | 10 | | PILGRIM REST RD | 10 | | COLLEGE | 8 | | HANSON DR | 8 | | HAROLD MONTGOMERY | 8 | | AMOS CUTOFF RD. | 6 | | BOBWHITE LOOP | 6 | | COLLEGE ST. | 6 | | DEMENT | 6 | | FOREMAN RD | 6 | | FULLER ST | 6 | | PLUM ORCHARD RD | 6 | | RAILROAD RIGHT OF WAY | 6 | | 299 AVALON SHORES | 4 | | AUDLEMAN | 4 | | BELLAIRE DR | 4 | | BOOTH CUT OFF | 4 |
| | | Fire incidents reported |
|---|
| Sreet name | Count |
|---|
| BOOTHVILLE CUTOFF | 4 | | BOOTHVILLE RD | 4 | | BROWNSTONE | 4 | | CAMP BISTINEAU | 4 | | CAMP ZION RD | 4 | | CLARK CR | 4 | | CLARKS CIRCLE | 4 | | COLLAGE ST | 4 | | COLLEGE ST | 4 | | COTY LANE | 4 | | DEMENT RD. | 4 | | GAS PLANT RD | 4 | | GREEN PARK | 4 | | GREEN PARK RD | 4 | | GREENTREE ST | 4 | | HAROLD MONTGOMERY ROAD | 4 | | HARVELL DAY | 4 | | HERREN | 4 | | HERREN RD | 4 | | HERREN ROAD | 4 | | HWY 164 | 4 | | JOHNSON | 4 | | JOHNSON RD | 4 | | JUNIOR EDWARDS | 4 | | |
|
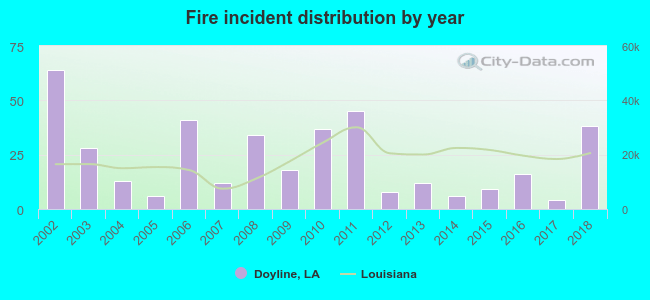 Based on the data from the years 2002 - 2018 the average number of fires per year is 23. The highest number of fires - 64 took place in 2002, and the least - 4 in 2017. The data has a declining trend.
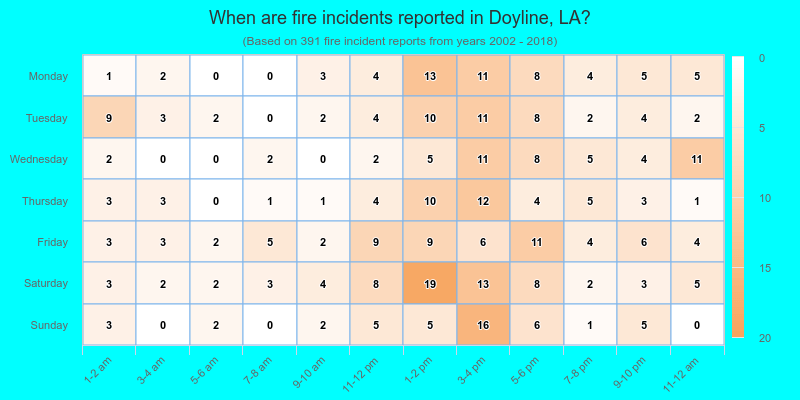
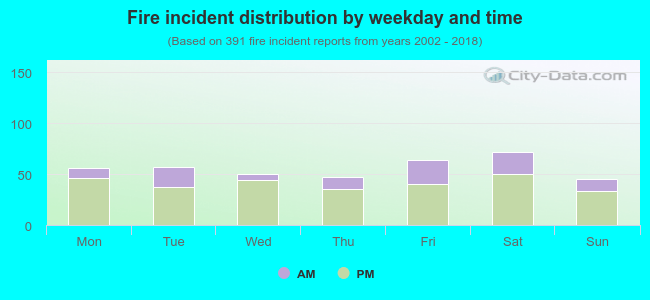 27.1% incidents where reported in the morning and 72.9% in the evening. The most fires (18.4%) took place on Saturday, and the least (11.5%) on Sunday.
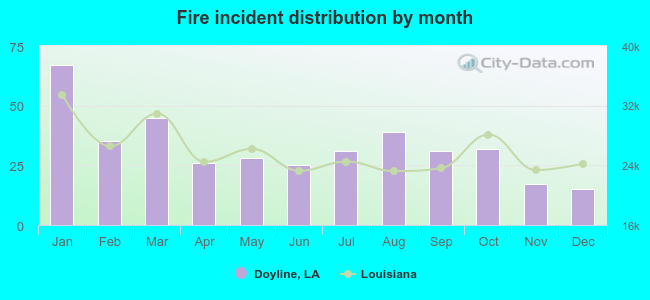 Based on the 391 fire incidents from years 2002 - 2018 most fires (17.1%) took place during January, and the least (3.8%) in December.
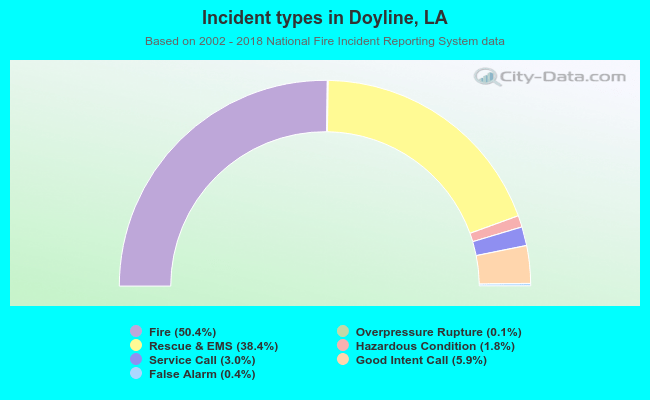 Out of all 776 cases reported during the years 2002 - 2018, the most belonged to the categories: Fire (50.4%), Rescue & EMS (38.4%), and Good Intent Call (5.9%).
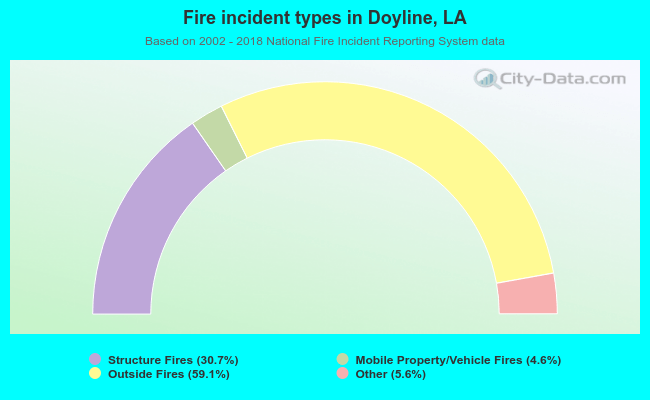 When looking into fire subcategories, the most incidents belonged to: Outside Fires (59.1%), and Structure Fires (30.7%).