Draper: Fire Incidents, Utah (UT)
Where are fire incidents reported in Draper, UT
Something went wrong! Please refresh the page.
| Fire incidents reported | |
|---|---|
| Sreet name | Count |
| I15 NB | 102 |
| MINUTEMAN DR | 94 |
| 12300 | 90 |
| 700 | 66 |
| I15 SB | 58 |
| 1300 | 54 |
| PIONEER RD | 52 |
| TRAVERSE RIDGE RD | 38 |
| I-15 SB FWY | 36 |
| STATE ST | 36 |
| PONY EXPRESS RD | 34 |
| FORT ST | 32 |
| DRAPER PKWY | 28 |
| I15 SB FWY | 28 |
| 13800 | 26 |
| 300 | 26 |
| HIGHLAND DR | 26 |
| BANGERTER EB HWY | 24 |
| 1300 E | 18 |
| 12300 S | 16 |
| 700 E | 16 |
| 800 | 16 |
| BANGERTER WB HWY | 14 |
| DRAPER PKY | 14 |
| KIMBALLS LN | 14 |
| LONE PEAK PKWY | 14 |
| OLD ENGLISH RD | 14 |
| 11400 | 12 |
| 12500 | 12 |
| 13200 | 12 |
| Other | 244 |
2002 - 2018 National Fire Incident Reporting System (NFIRS) incidents
- Incident types reported to NFIRS in Draper, UT
- 5,36851.1%Rescue & EMS
- 1,41513.5%Good Intent Call
- 1,26612.0%Fire
- 1,16011.0%False Alarm
- 7497.1%Hazardous Condition
- 4904.7%Service Call
- 230.2%Special Incident
- 210.2%Severe Weather
- 200.2%Overpressure Rupture
- Fire incident types reported to NFIRS in Draper, UT
- 53141.9%Outside Fires
- 38030.0%Structure Fires
- 27721.9%Mobile Property/Vehicle Fires
- 786.2%Other
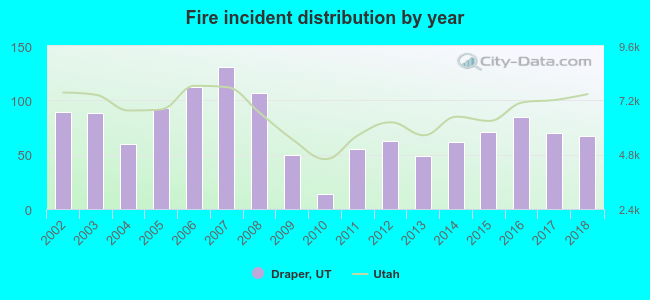 Based on the data from the years 2002 - 2018 the average number of fire incidents per year is 74. The highest number of fires - 131 took place in 2007, and the least - 14 in 2010. The data has a dropping trend.
The average number of yearly fire incidents per 10k residents in Draper, UT compared to nearest cities:
(Note: Based on data for the last 3 years, including only cities with population 5,000 and above)
| Draper: | 16.0 |
| Sandy: | 2.3 |
| Riverton: | 10.3 |
| Bluffdale: | 21.2 |
| South Jordan: | 9.0 |
| Alpine: | 8.2 |
| Midvale: | 27.1 |
| Cottonwood Heights: | 14.6 |
| Lehi: | 16.5 |
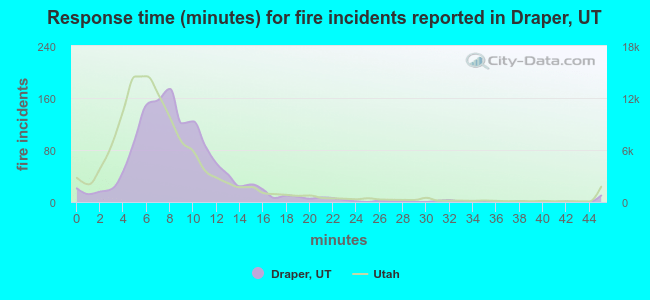 The median response time based on all reported fire incidents is 8 minutes. This is close to the state median value.
The median response time in Draper, UT compared to nearest cities:
(Note: Based on data for all years, including only cities with at least 500 fire incidents)
| Draper: | 8 minutes |
| Sandy: | 6 minutes |
| Riverton: | 7 minutes |
| South Jordan: | 7 minutes |
| Midvale: | 6 minutes |
| Cottonwood Heights: | 7 minutes |
| Lehi: | 7 minutes |
| West Jordan: | 6 minutes |
| Murray: | 6 minutes |
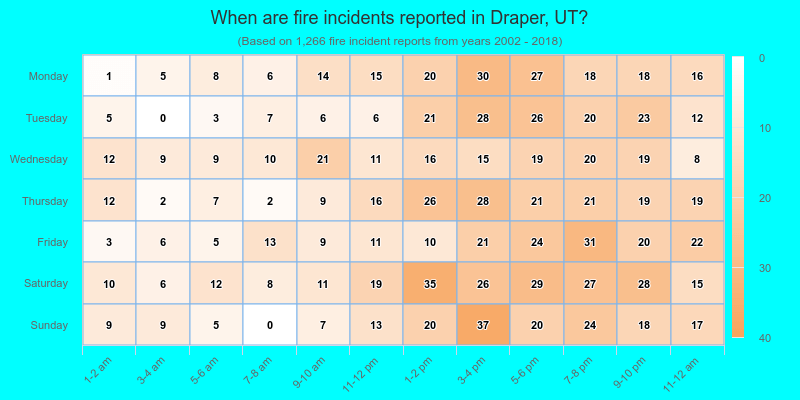
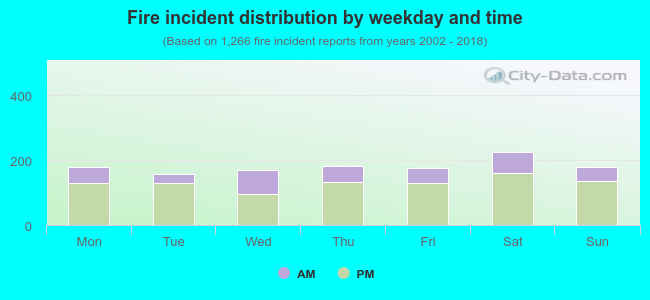 27.8% incidents where reported in the morning and 72.2% in the evening. The most fires (17.9%) took place on Saturday, and the least (12.4%) on Tuesday.
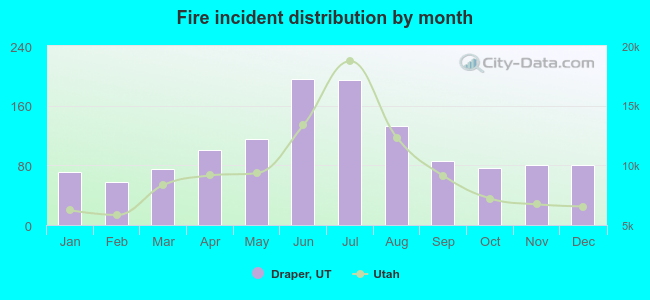 According to the 1,266 reports from years 2002 - 2018 most fires (15.5%) took place during June, and the least (4.6%) in February.
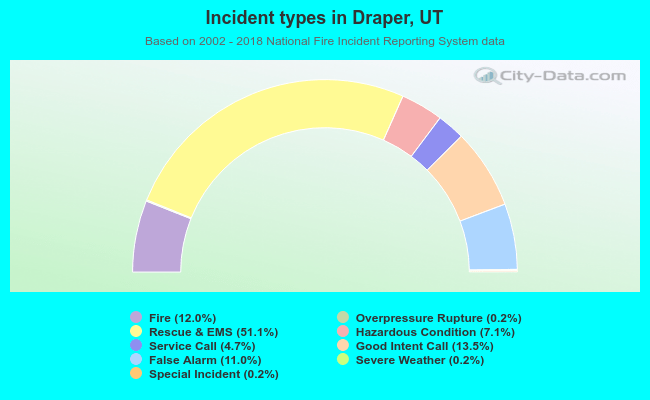 Out of all 10,512 cases reported during the years 2002 - 2018, the most belonged to the categories: Rescue & EMS (51.1%), Good Intent Call (13.5%), and Fire (12.0%).
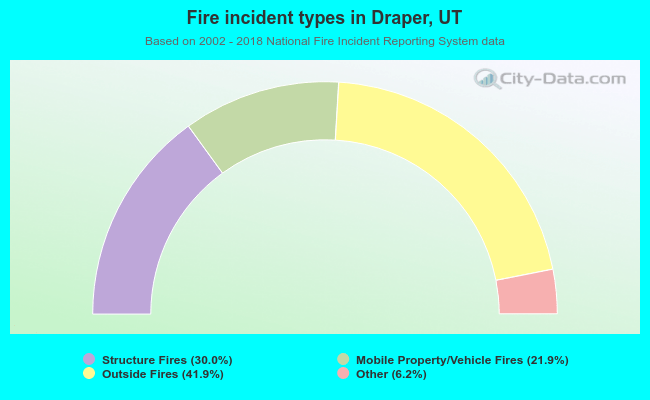 When looking into fire subcategories, the most incidents belonged to: Outside Fires (41.9%), and Structure Fires (30.0%).