Duarte: Fire Incidents, California (CA)
Where are fire incidents reported in Duarte, CA
Something went wrong! Please refresh the page.
|
| |||||||||||||||||||||||||||||||||||||||||||||||||||||||||||||||||||||||||||||||||||||||||||||||||||||||||||||
2005 - 2018 National Fire Incident Reporting System (NFIRS) incidents
- Incident types reported to NFIRS in Duarte, CA
- 6,00967.7%Rescue & EMS
- 1,52717.2%Good Intent Call
- 4685.3%False Alarm
- 4064.6%Fire
- 2312.6%Service Call
- 2232.5%Hazardous Condition
- 120.1%Special Incident
- Fire incident types reported to NFIRS in Duarte, CA
- 15738.7%Structure Fires
- 12731.3%Outside Fires
- 8320.4%Mobile Property/Vehicle Fires
- 399.6%Other
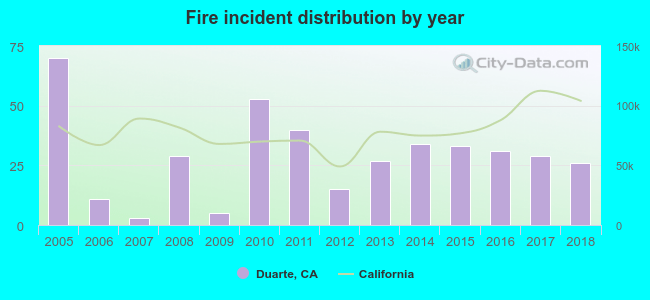 According to the data from the years 2005 - 2018 the average number of fire incidents per year is 29. The highest number of fires - 70 took place in 2005, and the least - 3 in 2007. The data has a declining trend.
The average number of yearly fire incidents per 10k residents in Duarte, CA compared to nearest cities:
(Note: Based on data for the last 3 years, including only cities with population 5,000 and above)
| Duarte: | 13.0 |
| Monrovia: | 21.6 |
| Azusa: | 13.9 |
| Baldwin Park: | 8.9 |
| Arcadia: | 12.9 |
| Sierra Madre: | 20.6 |
| Covina: | 12.7 |
| El Monte: | 14.1 |
| Temple City: | 7.8 |
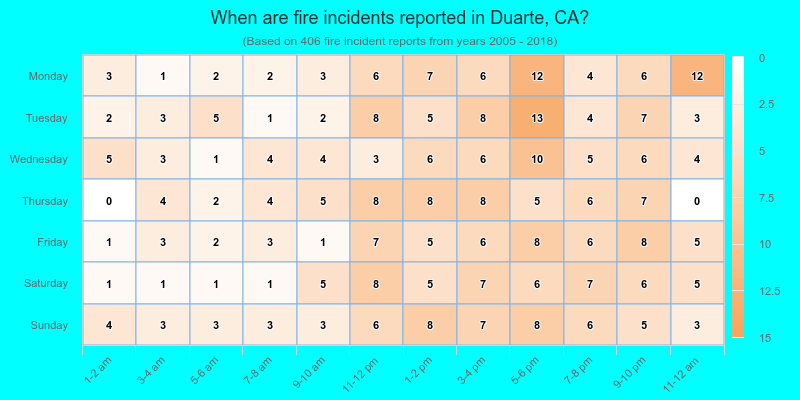
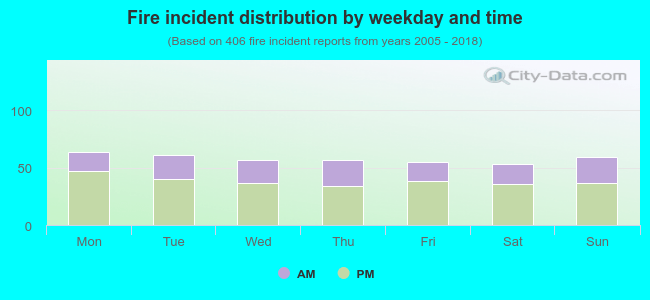 33.7% incidents where reported in the morning and 66.3% in the evening. The most fires (15.8%) took place on Monday, and the least (13.1%) on Saturday.
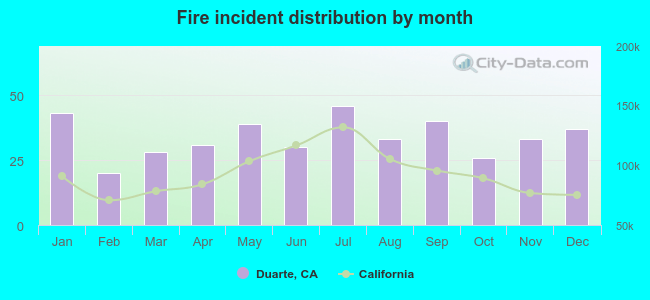 According to the 406 fires from years 2005 - 2018 most fires (11.3%) took place during July, and the least (4.9%) in February.
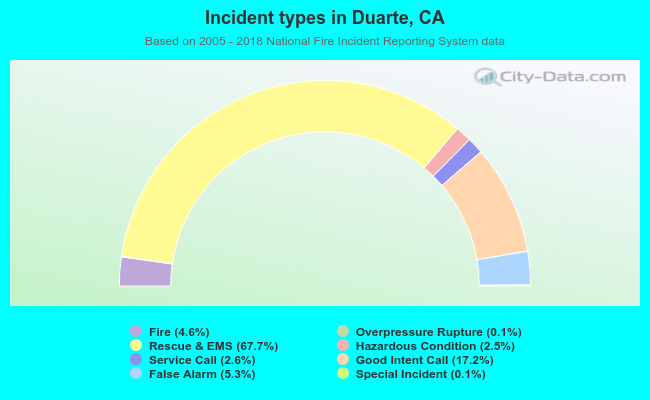 Out of all 8,881 cases reported during the years 2005 - 2018, the most belonged to the categories: Rescue & EMS (67.7%), Good Intent Call (17.2%), and False Alarm (5.3%).
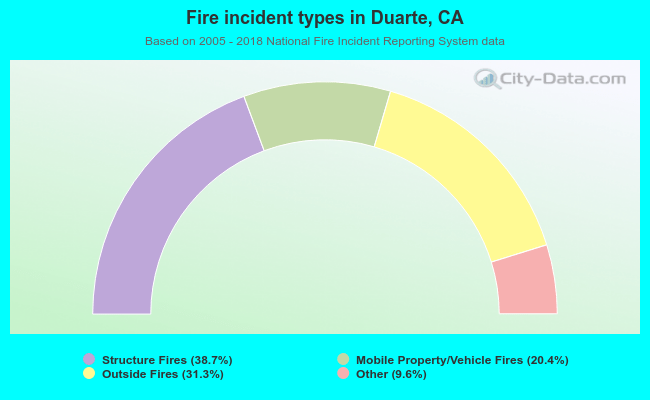 When looking into fire subcategories, the most reports belonged to: Structure Fires (38.7%), and Outside Fires (31.3%).