Durham: Fire Incidents, California (CA)
Where are fire incidents reported in Durham, CA
Something went wrong! Please refresh the page.
|
| |||||||||||||||||||||||||||||||||||||||||||||||||||||||||||||||||||||||||||||||||||||||||||||||||||||||||||||
2003 - 2016 National Fire Incident Reporting System (NFIRS) incidents
- Incident types reported to NFIRS in Durham, CA
- 24649.9%Rescue & EMS
- 10020.3%Fire
- 5210.5%Service Call
- 326.5%Hazardous Condition
- 255.1%False Alarm
- 193.9%Good Intent Call
- 193.9%Special Incident
- Fire incident types reported to NFIRS in Durham, CA
- 5353.0%Outside Fires
- 1919.0%Structure Fires
- 1919.0%Mobile Property/Vehicle Fires
- 99.0%Other
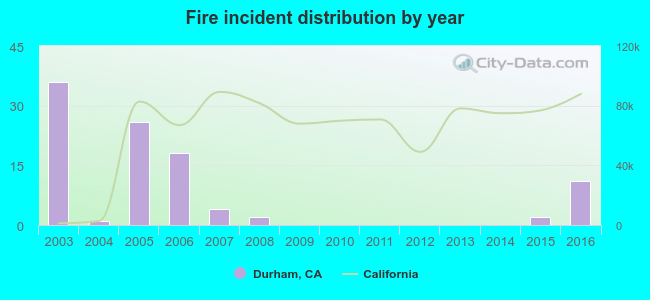 According to the data from the years 2003 - 2016 the average number of fire incidents per year is 7. The highest number of fires - 36 took place in 2003, and the least - 0 in 2009. The data has a declining trend.
The average number of yearly fire incidents per 10k residents in Durham, CA compared to nearest cities:
(Note: Based on data for the last 3 years, including only cities with population 5,000 and above)
| Durham: | 19.9 |
| Chico: | 40.1 |
| Paradise: | 4.4 |
| Thermalito: | 30.6 |
| Oroville: | 7.8 |
| Magalia: | 0.9 |
| Palermo: | 78.7 |
| Gridley: | 7.6 |
| Orland: | 1.8 |
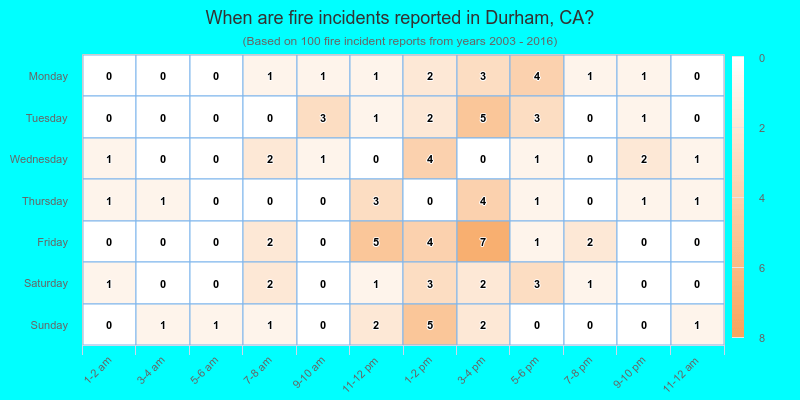
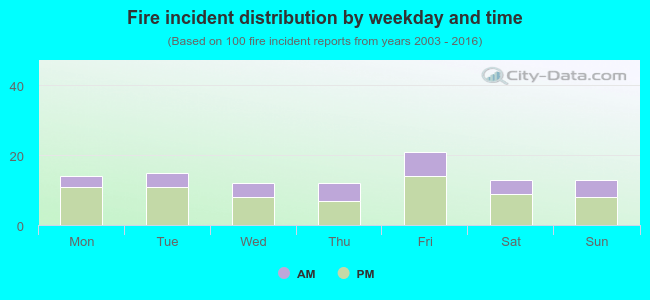 32.0% incidents where reported in the morning and 68.0% in the evening. The most fires (21.0%) took place on Friday, and the least (12.0%) on Wednesday.
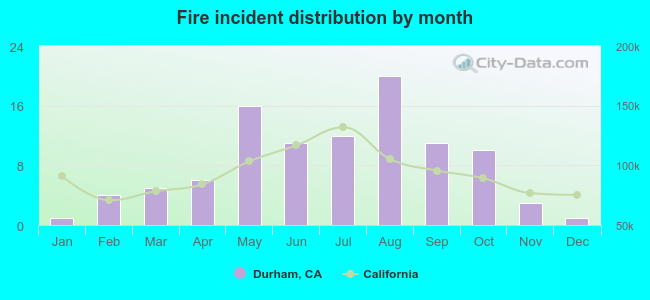 According to the 100 fire incidents from years 2003 - 2016 most fires (20.0%) took place during August, and the least (1.0%) in January.
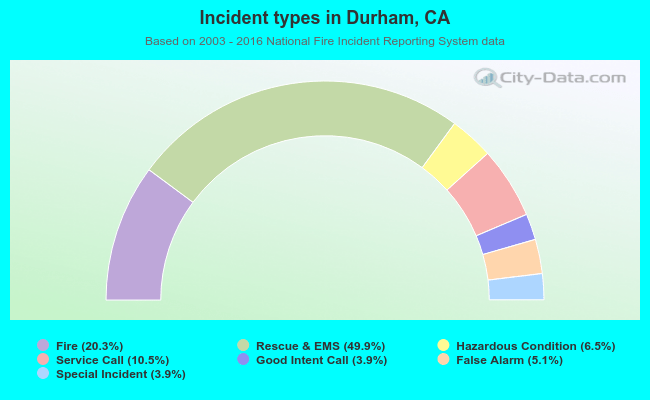 Out of all 493 cases reported during the years 2003 - 2016, the most belonged to the categories: Overpressure Rupture (49.9%), Fire (20.3%), and Hazardous Condition (10.5%).
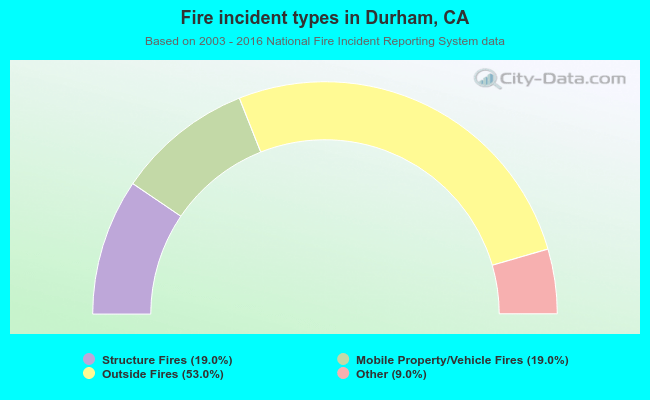 When looking into fire subcategories, the most incidents belonged to: Outside Fires (53.0%), and Structure Fires (19.0%).