Eagle Mountain: Fire Incidents, Utah (UT)
Where are fire incidents reported in Eagle Mountain, UT
Something went wrong! Please refresh the page.
|
| |||||||||||||||||||||||||||||||||||||||||||||||||||||||||||||||||||||||||||||||||||||||||||||||||||||||||||||
| Other | 186 | |||||||||||||||||||||||||||||||||||||||||||||||||||||||||||||||||||||||||||||||||||||||||||||||||||||||||||||
2002 - 2018 National Fire Incident Reporting System (NFIRS) incidents
- Incident types reported to NFIRS in Eagle Mountain, UT
- 2,02847.2%Rescue & EMS
- 84319.6%Good Intent Call
- 50611.8%Fire
- 3959.2%False Alarm
- 3869.0%Hazardous Condition
- 1232.9%Service Call
- 50.1%Special Incident
- Fire incident types reported to NFIRS in Eagle Mountain, UT
- 23446.2%Outside Fires
- 18436.4%Structure Fires
- 448.7%Mobile Property/Vehicle Fires
- 448.7%Other
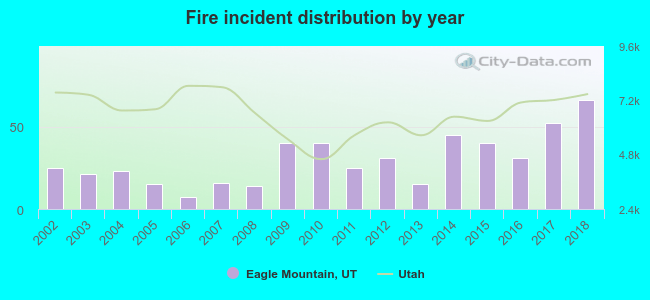 Based on the data from the years 2002 - 2018 the average number of fire incidents per year is 30. The highest number of fires - 66 took place in 2018, and the least - 7 in 2006. The data has a growing trend.
The average number of yearly fire incidents per 10k residents in Eagle Mountain, UT compared to nearest cities:
(Note: Based on data for the last 3 years, including only cities with population 5,000 and above)
| Eagle Mountain: | 19.4 |
| Saratoga Springs: | 8.8 |
| Lehi: | 16.5 |
| Bluffdale: | 21.2 |
| American Fork: | 16.9 |
| Highland: | 7.4 |
| Herriman: | 16.2 |
| Cedar Hills: | 5.8 |
| Riverton: | 10.3 |
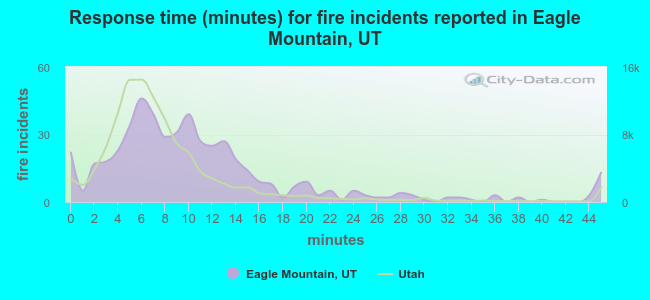 The median response time based on all reported fire incidents is 9 minutes. This is higher than the state median value.
The median response time in Eagle Mountain, UT compared to nearest cities:
(Note: Based on data for all years, including only cities with at least 500 fire incidents)
| Eagle Mountain: | 9 minutes |
| Lehi: | 7 minutes |
| American Fork: | 7 minutes |
| Riverton: | 7 minutes |
| Pleasant Grove: | 6 minutes |
| Draper: | 8 minutes |
| Orem: | 5 minutes |
| South Jordan: | 7 minutes |
| Provo: | 6 minutes |
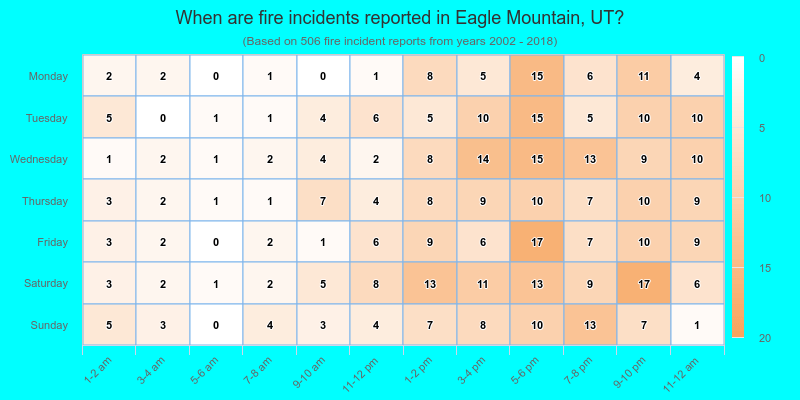
 21.1% incidents where reported in the morning and 78.9% in the evening. The most fires (17.8%) took place on Saturday, and the least (10.9%) on Monday.
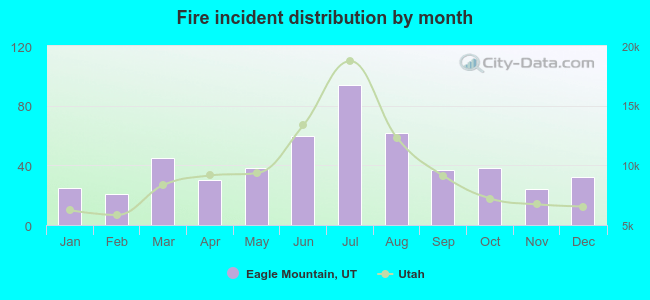 According to the 506 reports from years 2002 - 2018 most fires (18.6%) took place during July, and the least (4.2%) in February.
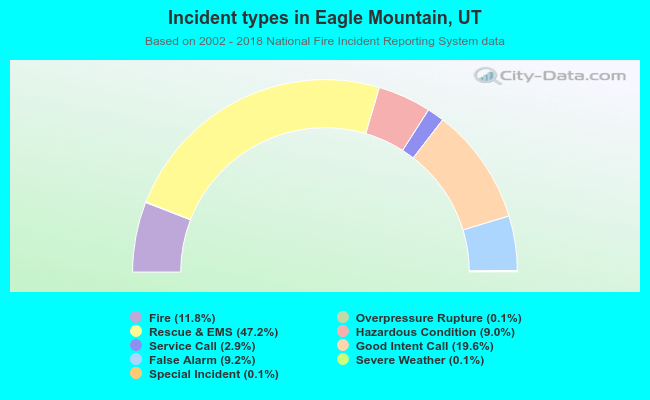 Out of all 4,293 cases reported during the years 2002 - 2018, the most belonged to the categories: Rescue & EMS (47.2%), Good Intent Call (19.6%), and Fire (11.8%).
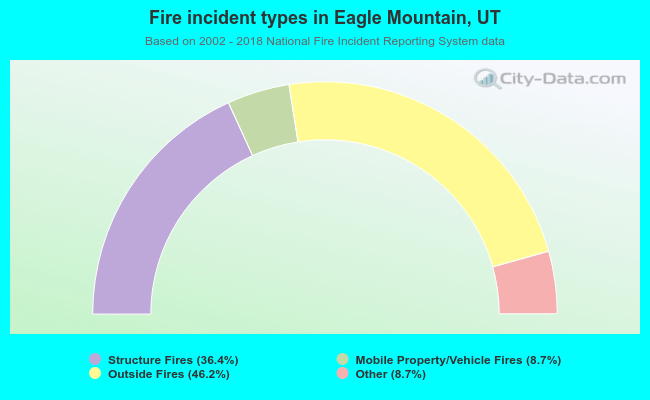 When looking into fire subcategories, the most incidents belonged to: Outside Fires (46.2%), and Structure Fires (36.4%).