Ebensburg: Fire Incidents, Pennsylvania (PA)
Where are fire incidents reported in Ebensburg, PA
Something went wrong! Please refresh the page.
|
| |||||||||||||||||||||||||||||||||||||||||||||||||||||||||||||||||||||||||||||||||||||||||||||||||||||||||||||
2003 - 2018 National Fire Incident Reporting System (NFIRS) incidents
- Incident types reported to NFIRS in Ebensburg, PA
- 21124.4%Hazardous Condition
- 18321.2%Fire
- 15918.4%Rescue & EMS
- 11012.7%Service Call
- 10912.6%Good Intent Call
- 799.1%False Alarm
- 80.9%Special Incident
- 50.6%Severe Weather
- 10.1%Overpressure Rupture
- Fire incident types reported to NFIRS in Ebensburg, PA
- 10758.5%Structure Fires
- 4021.9%Outside Fires
- 2513.7%Mobile Property/Vehicle Fires
- 116.0%Other
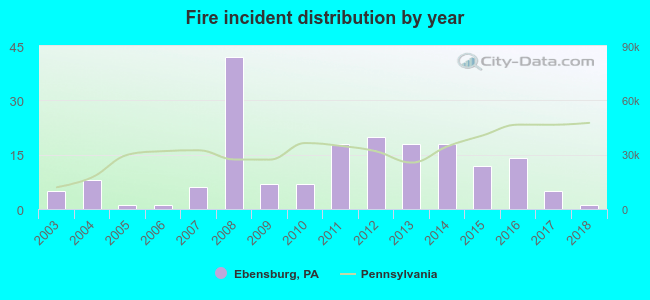 According to the data from the years 2003 - 2018 the average number of fire incidents per year is 11. The highest number of reported fires - 42 took place in 2008, and the least - 1 in 2005. The data has a decreasing trend.
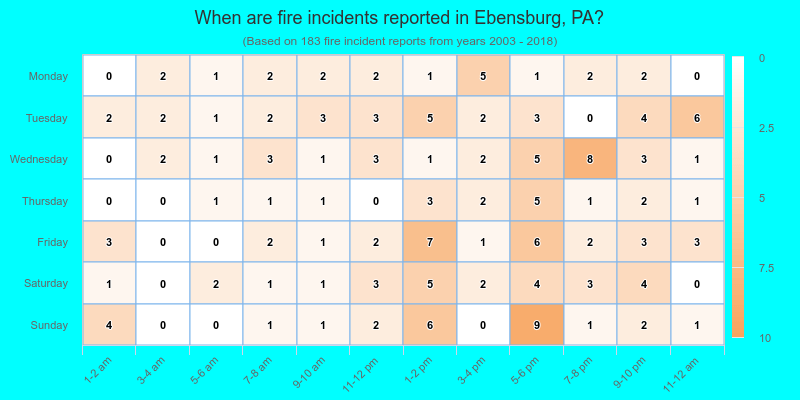
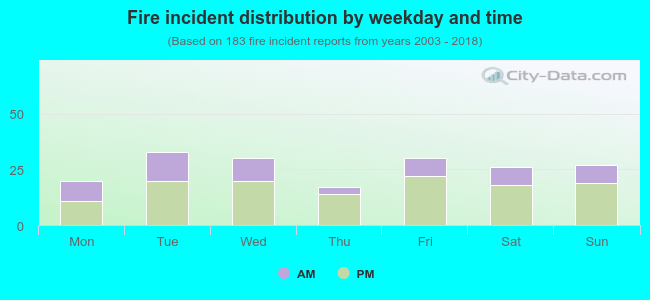 32.2% incidents where reported in the morning and 67.8% in the evening. The most fires (18.0%) took place on Tuesday, and the least (9.3%) on Thursday.
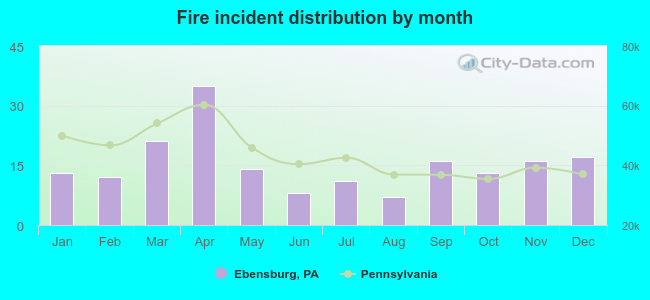 Based on the 183 incident reports from years 2003 - 2018 most fires (19.1%) took place during April, and the least (3.8%) in August.
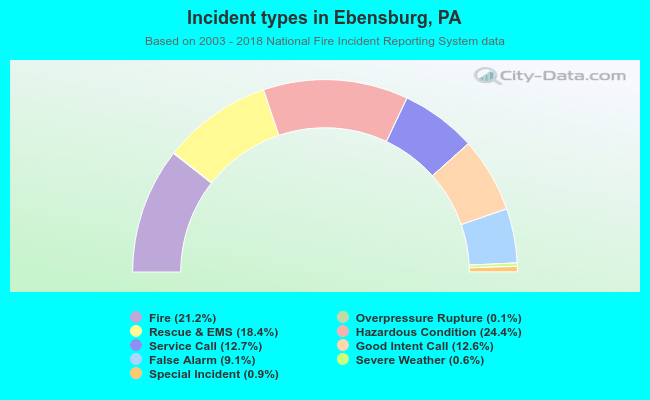 Out of all 865 cases reported during the years 2003 - 2018, the most belonged to the categories: Hazardous Condition (24.4%), Fire (21.2%), and Rescue & EMS (18.4%).
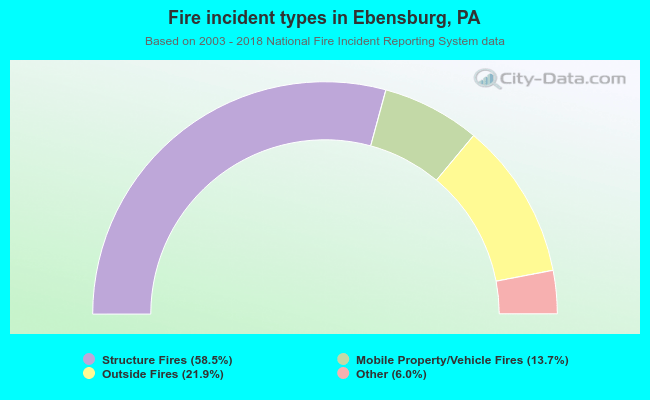 When looking into fire subcategories, the most reports belonged to: Structure Fires (58.5%), and Outside Fires (21.9%).