Edgecliff Village: Fire Incidents, Texas (TX)
Where are fire incidents reported in Edgecliff Village, TX
Something went wrong! Please refresh the page.
|
| |||||||||||||||||||||||||||||||||||||||||||||||||||||||||||||||||||||||||||||||||||||||||||||||||||||||||||||
2002 - 2018 National Fire Incident Reporting System (NFIRS) incidents
- Incident types reported to NFIRS in Edgecliff Village, TX
- 90761.1%Rescue & EMS
- 15710.6%Service Call
- 1298.7%Fire
- 1157.7%Hazardous Condition
- 1047.0%False Alarm
- 634.2%Good Intent Call
- 60.4%Severe Weather
- 20.1%Overpressure Rupture
- 20.1%Special Incident
- Fire incident types reported to NFIRS in Edgecliff Village, TX
- 5945.7%Outside Fires
- 5240.3%Structure Fires
- 97.0%Mobile Property/Vehicle Fires
- 97.0%Other
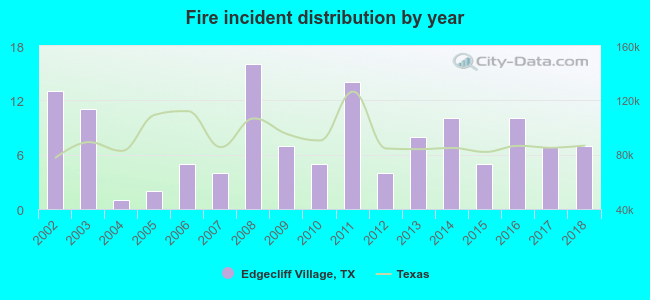 Based on the data from the years 2002 - 2018 the average number of fire incidents per year is 8. The highest number of reported fire incidents - 16 took place in 2008, and the least - 1 in 2004. The data has a declining trend.
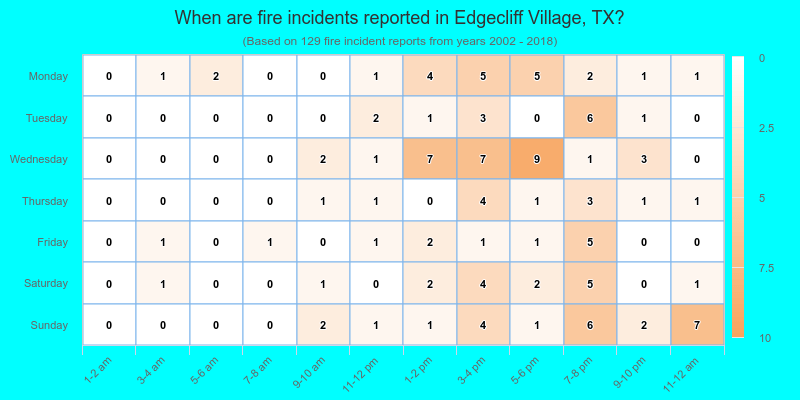
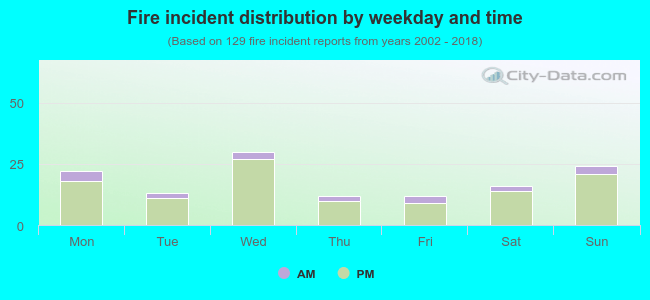 14.7% incidents where reported in the morning and 85.3% in the evening. The most fires (23.3%) took place on Wednesday, and the least (9.3%) on Thursday.
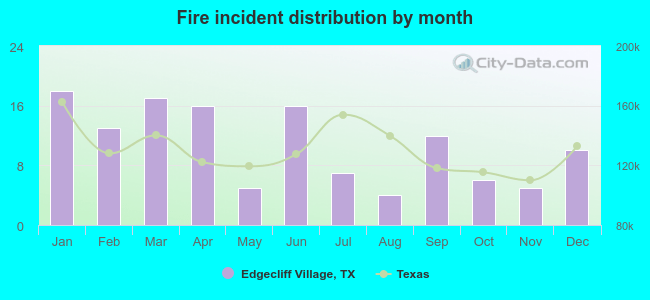 Based on the 129 fire incident reports from years 2002 - 2018 most fires (14.0%) took place during January, and the least (3.1%) in August.
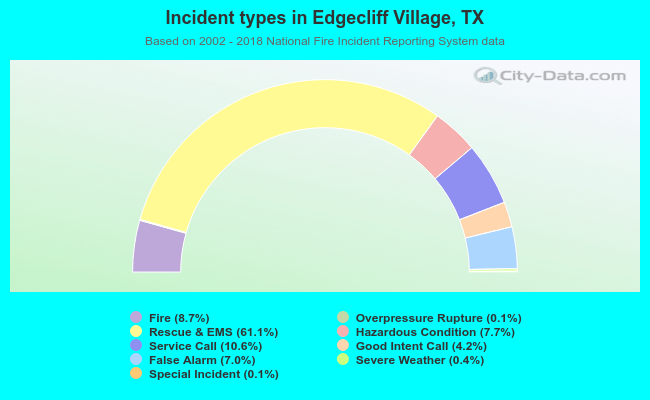 Out of all 1,485 cases reported during the years 2002 - 2018, the most belonged to the categories: Rescue & EMS (61.1%), Service Call (10.6%), and Fire (8.7%).
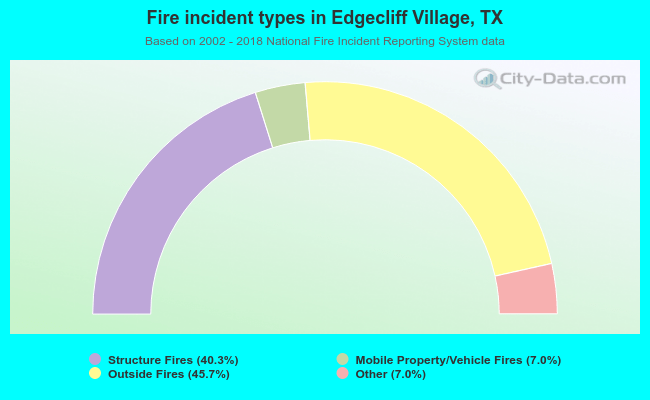 When looking into fire subcategories, the most incidents belonged to: Outside Fires (45.7%), and Structure Fires (40.3%).