Elizabeth: Fire Incidents, Colorado (CO)
Where are fire incidents reported in Elizabeth, CO
Something went wrong! Please refresh the page.
|
| |||||||||||||||||||||||||||||||||||||||||||||||||||||||||||||||||||||||||||||||||||||||||||||||||||||||||||||
| Other | 99 | |||||||||||||||||||||||||||||||||||||||||||||||||||||||||||||||||||||||||||||||||||||||||||||||||||||||||||||
2003 - 2018 National Fire Incident Reporting System (NFIRS) incidents
- Incident types reported to NFIRS in Elizabeth, CO
- 1,92145.7%Rescue & EMS
- 55313.2%Fire
- 52812.6%Hazardous Condition
- 45510.8%Good Intent Call
- 44410.6%Service Call
- 2024.8%False Alarm
- 801.9%Special Incident
- 140.3%Severe Weather
- 80.2%Overpressure Rupture
- Fire incident types reported to NFIRS in Elizabeth, CO
- 25345.8%Outside Fires
- 22340.3%Structure Fires
- 417.4%Mobile Property/Vehicle Fires
- 366.5%Other
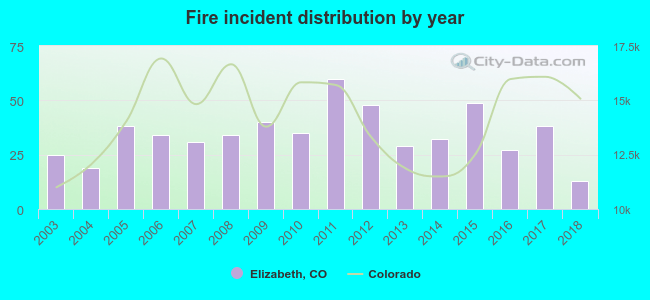 According to the data from the years 2003 - 2018 the average number of fire incidents per year is 35. The highest number of fire incidents - 60 took place in 2011, and the least - 13 in 2018. The data has a dropping trend.
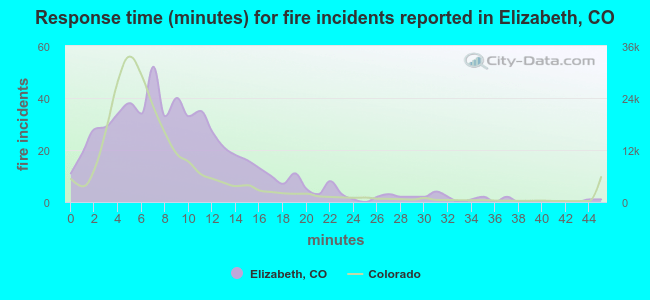 The median response time based on all reported fire incidents is 8 minutes. This is higher compared to the state median value.
The median response time in Elizabeth, CO compared to nearest cities:
(Note: Based on data for all years, including only cities with at least 500 fire incidents)
| Elizabeth: | 8 minutes |
| Castle Rock: | 7 minutes |
| Parker: | 7 minutes |
| Sedalia: | 15 minutes |
| Lone Tree: | 6 minutes |
| Centennial: | 6 minutes |
| Highlands Ranch: | 7 minutes |
| Peyton: | 12 minutes |
| Monument: | 8 minutes |
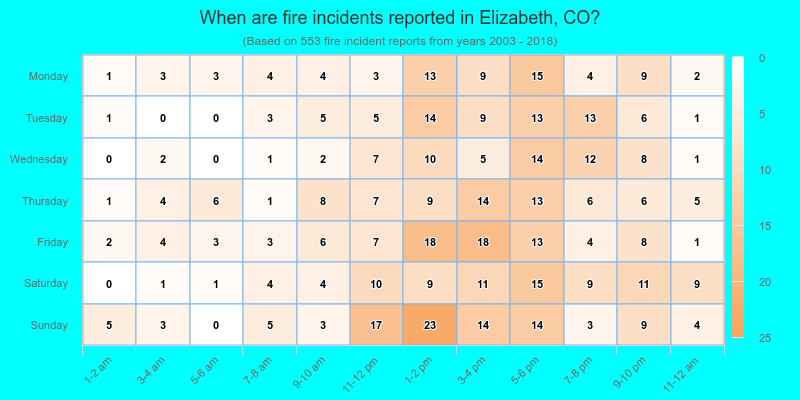
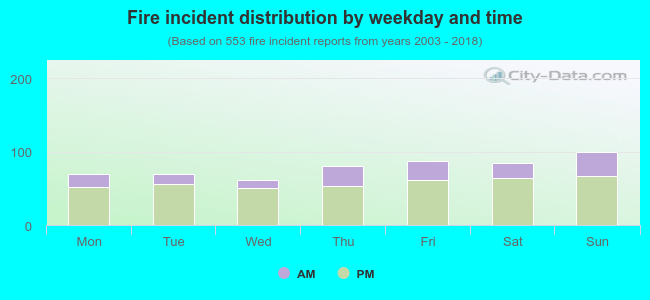 26.9% incidents where reported in the morning and 73.1% in the evening. The most fires (18.1%) took place on Sunday, and the least (11.2%) on Wednesday.
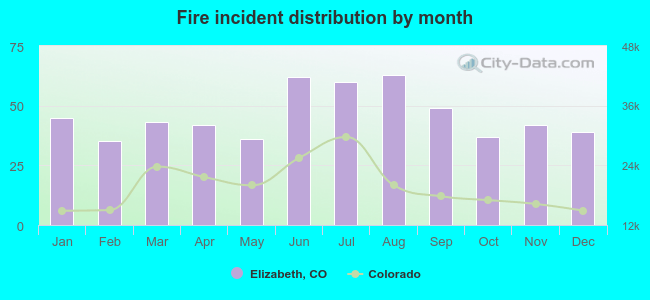 According to the 553 reports from years 2003 - 2018 most fires (11.4%) took place during August, and the least (6.3%) in February.
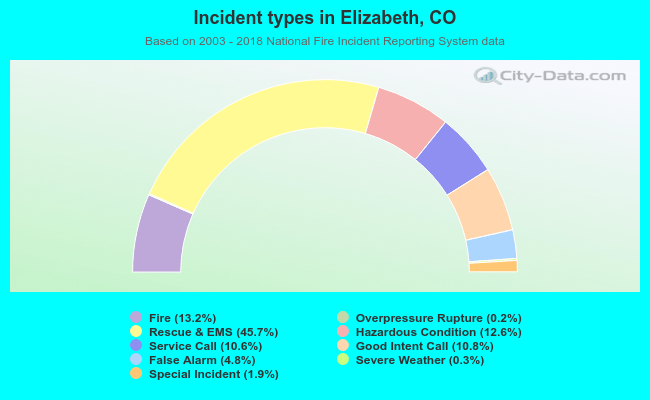 Out of all 4,205 cases reported during the years 2003 - 2018, the most belonged to the categories: Rescue & EMS (45.7%), Fire (13.2%), and Hazardous Condition (12.6%).
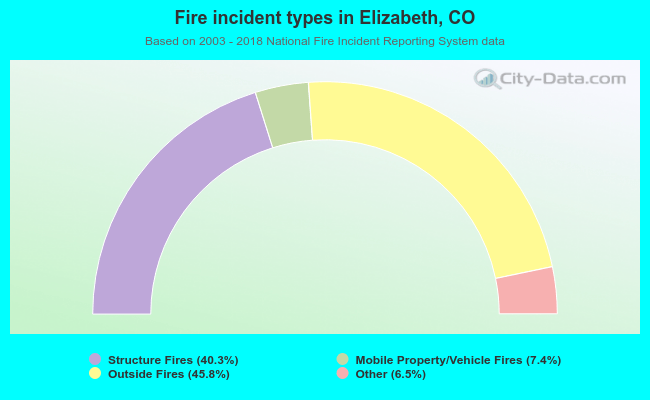 When looking into fire subcategories, the most reports belonged to: Outside Fires (45.8%), and Structure Fires (40.3%).