Emlenton: Fire Incidents, Pennsylvania (PA)
Where are fire incidents reported in Emlenton, PA
Something went wrong! Please refresh the page.
|
| |||||||||||||||||||||||||||||||||||||||||||||||||||||||||||||||||||||||||||||||||||||||||||||||||||||||||||||
2005 - 2018 National Fire Incident Reporting System (NFIRS) incidents
- Incident types reported to NFIRS in Emlenton, PA
- 36036.8%Rescue & EMS
- 17618.0%Service Call
- 17217.6%Fire
- 14314.6%Hazardous Condition
- 10510.7%Good Intent Call
- 161.6%False Alarm
- 30.3%Special Incident
- 20.2%Overpressure Rupture
- 20.2%Severe Weather
- Fire incident types reported to NFIRS in Emlenton, PA
- 10058.1%Structure Fires
- 3218.6%Outside Fires
- 2112.2%Other
- 1911.0%Mobile Property/Vehicle Fires
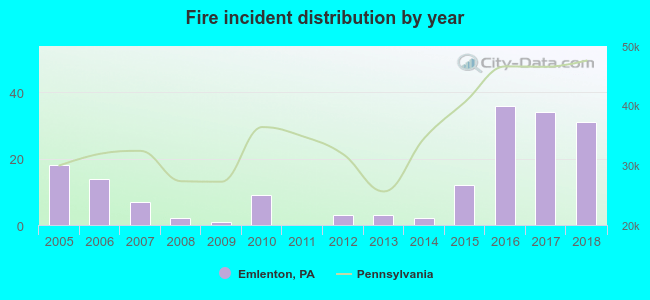 According to the data from the years 2005 - 2018 the average number of fire incidents per year is 12. The highest number of fires - 36 took place in 2016, and the least - 0 in 2011. The data has a rising trend.
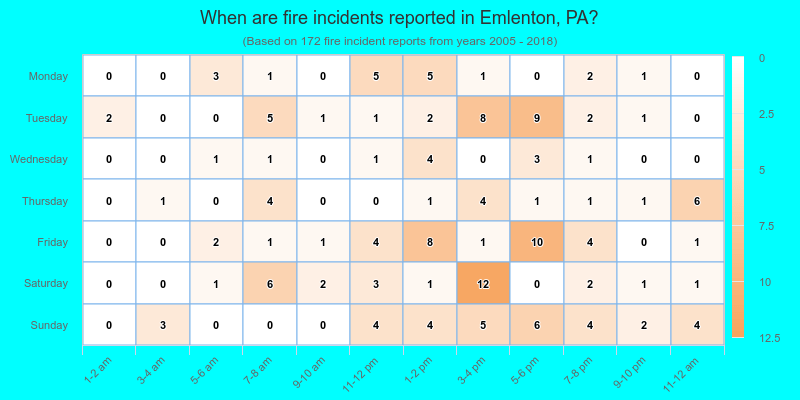
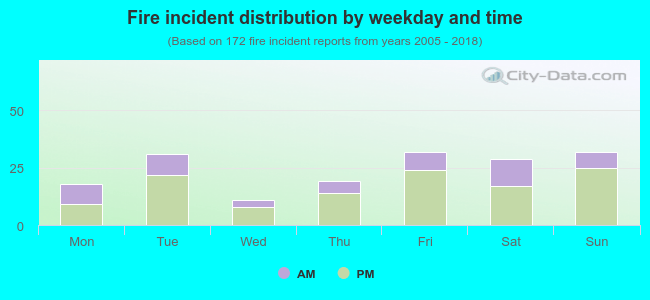 30.8% incidents where reported in the morning and 69.2% in the evening. The most fires (18.6%) took place on Friday, and the least (6.4%) on Wednesday.
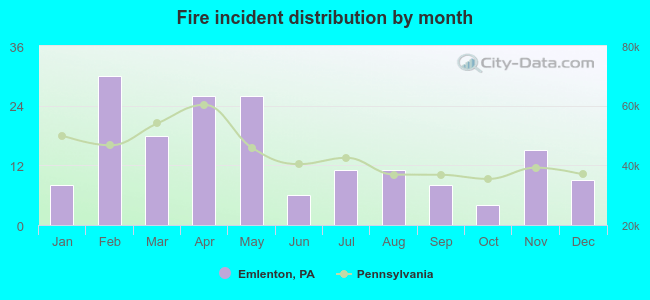 Based on the 172 reports from years 2005 - 2018 most fires (17.4%) took place during February, and the least (2.3%) in October.
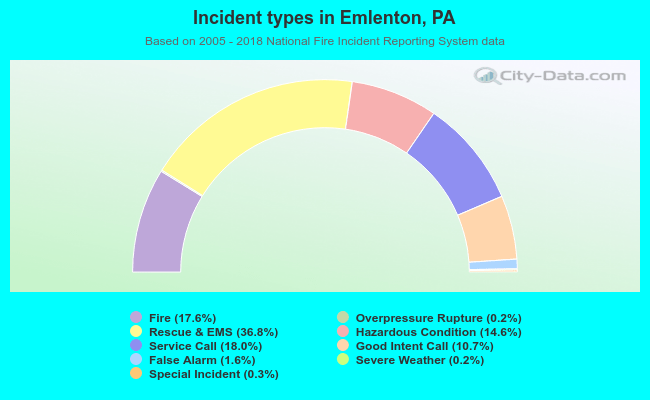 Out of all 979 cases reported during the years 2005 - 2018, the most belonged to the categories: Rescue & EMS (36.8%), Service Call (18.0%), and Fire (17.6%).
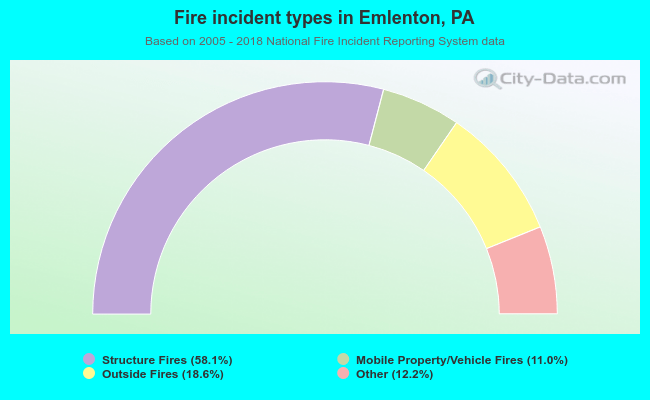 When looking into fire subcategories, the most reports belonged to: Structure Fires (58.1%), and Outside Fires (18.6%).