Enola: Fire Incidents, Pennsylvania (PA)
Where are fire incidents reported in Enola, PA
Something went wrong! Please refresh the page.
| Fire incidents reported | |
|---|---|
| Sreet name | Count |
| ENOLA DR | 400 |
| ENOLA RD | 140 |
| WERTZVILLE RD | 114 |
| SHADY LN | 78 |
| DAUPHIN ST | 54 |
| VALLEY RD | 52 |
| COLLEGE HILL RD | 42 |
| MAGARO RD | 42 |
| ADAMS ST | 40 |
| COLUMBIA RD | 38 |
| CREEKSIDE DR | 30 |
| I81 HWY | 30 |
| 81 HWY | 28 |
| STATE ST | 26 |
| 3RD ST | 24 |
| 81 INT | 24 |
| I81 | 24 |
| SECOND ST | 24 |
| THIRD ST | 24 |
| YORK ST | 24 |
| ALTOONA AVE | 22 |
| ASHFORD DR | 22 |
| BLUE SPRUCE DR | 22 |
| SUSQUEHANNA AVE | 22 |
| BRIAN DR | 20 |
| CENTER ST | 20 |
| CUMBERLAND RD | 20 |
| EAST PENN DR | 20 |
| ERFORD RD | 20 |
| PINE ST | 20 |
2004 - 2018 National Fire Incident Reporting System (NFIRS) incidents
- Incident types reported to NFIRS in Enola, PA
- 1,32339.2%Fire
- 57317.0%Hazardous Condition
- 43813.0%Rescue & EMS
- 40211.9%Good Intent Call
- 35910.6%False Alarm
- 1825.4%Service Call
- 902.7%Severe Weather
- 100.3%Overpressure Rupture
- Fire incident types reported to NFIRS in Enola, PA
- 74456.2%Structure Fires
- 29422.2%Other
- 17012.8%Outside Fires
- 1158.7%Mobile Property/Vehicle Fires
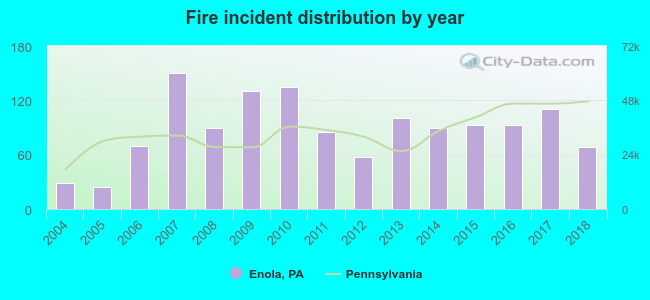 According to the data from the years 2004 - 2018 the average number of fires per year is 88. The highest number of fires - 150 took place in 2007, and the least - 24 in 2005. The data has a growing trend.
The average number of yearly fire incidents per 10k residents in Enola, PA compared to nearest cities:
(Note: Based on data for the last 3 years, including only cities with population 5,000 and above)
| Enola: | 148.4 |
| Harrisburg: | 188.7 |
| Camp Hill: | 137.3 |
| New Cumberland: | 60.1 |
| Mechanicsburg: | 254.2 |
| Steelton: | 64.1 |
| Middletown: | 69.5 |
| Hershey: | 37.4 |
| Carlisle: | 88.1 |
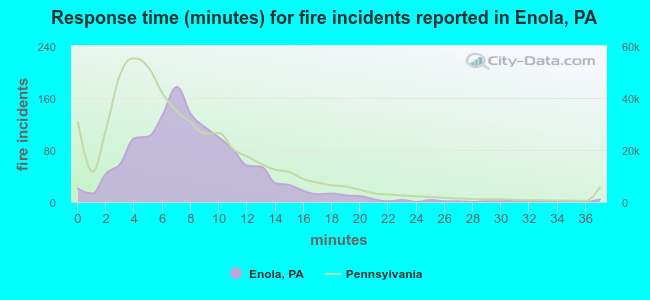 The median response time based on all reported fire incidents is 8 minutes. This is higher than the Pennsylvania median value.
The median response time in Enola, PA compared to nearest cities:
(Note: Based on data for all years, including only cities with at least 500 fire incidents)
| Enola: | 8 minutes |
| Harrisburg: | 6 minutes |
| Camp Hill: | 8 minutes |
| Dauphin: | 12 minutes |
| New Cumberland: | 9 minutes |
| Mechanicsburg: | 9 minutes |
| Steelton: | 7 minutes |
| Duncannon: | 11 minutes |
| Hummelstown: | 10 minutes |
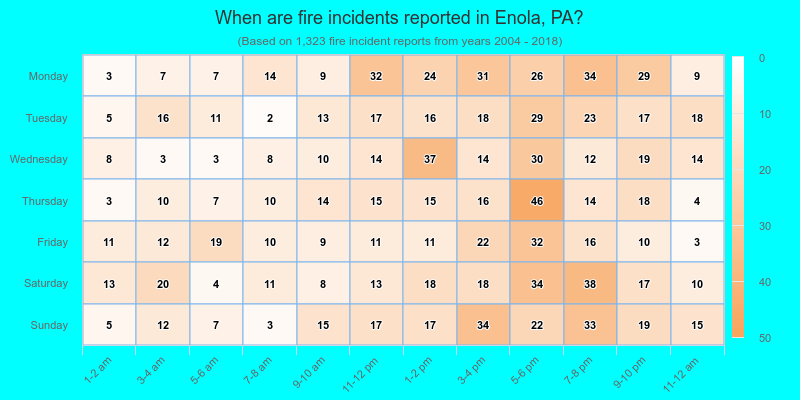
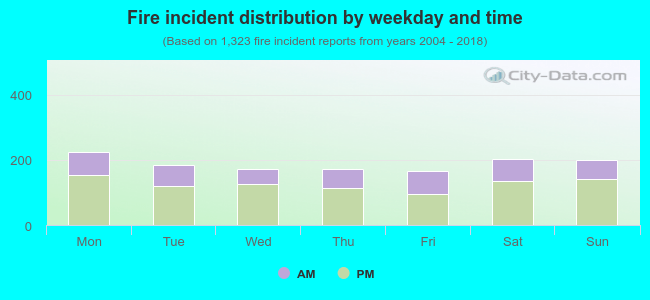 33.3% incidents where reported in the morning and 66.7% in the evening. The most fires (17.0%) took place on Monday, and the least (12.5%) on Friday.
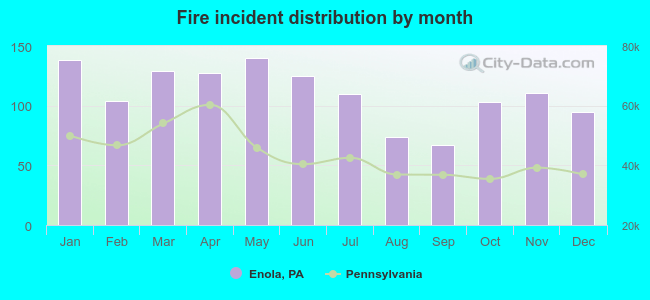 According to the 1,323 reports from years 2004 - 2018 most fires (10.6%) took place during May, and the least (5.1%) in September.
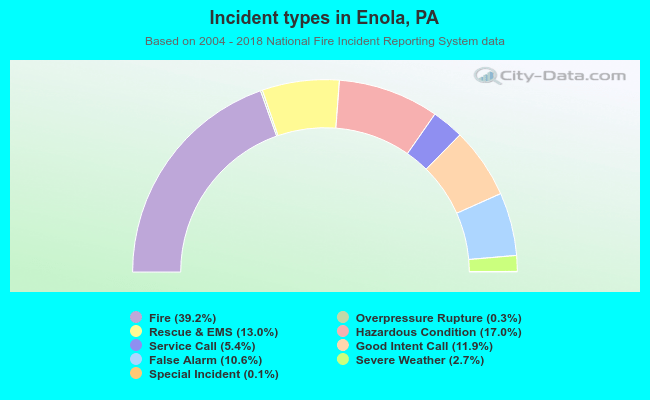 Out of all 3,379 cases reported during the years 2004 - 2018, the most belonged to the categories: Fire (39.2%), Hazardous Condition (17.0%), and Rescue & EMS (13.0%).
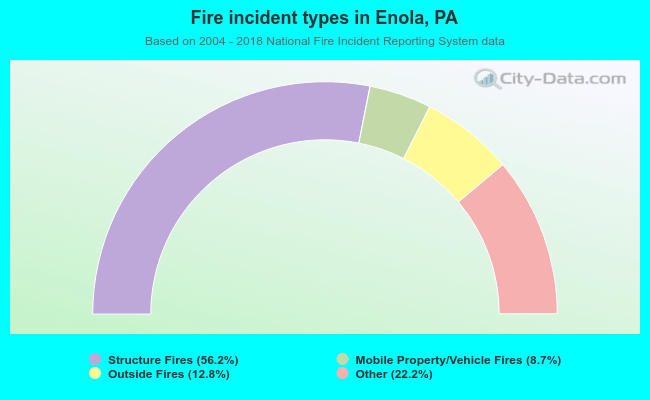 When looking into fire subcategories, the most reports belonged to: Structure Fires (56.2%), and Other (22.2%).