Essex: Fire Incidents, Vermont (VT)
Where are fire incidents reported in Essex, VT
Something went wrong! Please refresh the page.
|
| |||||||||||||||||||||||||||||||||||||||||||||||||||||||||||||||||||||||||||||||||||||||||||||||||||||||||||||
2002 - 2018 National Fire Incident Reporting System (NFIRS) incidents
- Incident types reported to NFIRS in Essex, VT
- 61839.5%Hazardous Condition
- 30219.3%Rescue & EMS
- 25716.4%Fire
- 1519.6%False Alarm
- 1479.4%Service Call
- 845.4%Good Intent Call
- 20.1%Overpressure Rupture
- 20.1%Severe Weather
- 20.1%Special Incident
- Fire incident types reported to NFIRS in Essex, VT
- 11444.4%Structure Fires
- 9938.5%Outside Fires
- 3513.6%Mobile Property/Vehicle Fires
- 93.5%Other
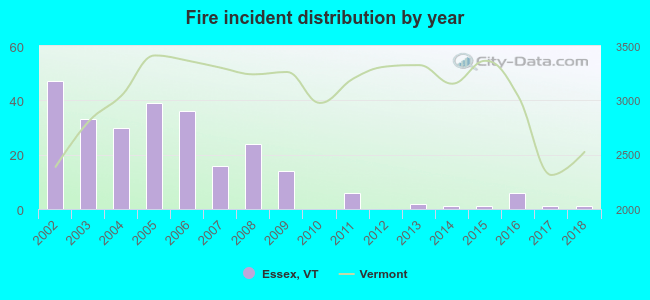 Based on the data from the years 2002 - 2018 the average number of fire incidents per year is 15. The highest number of fire incidents - 47 took place in 2002, and the least - 0 in 2010. The data has a decreasing trend.
The average number of yearly fire incidents per 10k residents in Essex, VT compared to nearest cities:
(Note: Based on data for the last 3 years, including only cities with population 5,000 and above)
| Essex: | 1.4 |
| Essex Junction: | 59.0 |
| Williston: | 36.8 |
| Winooski: | 101.5 |
| South Burlington: | 33.6 |
| Colchester: | 28.9 |
| Burlington: | 29.8 |
| Shelburne: | 38.3 |
| Montpelier: | 37.8 |
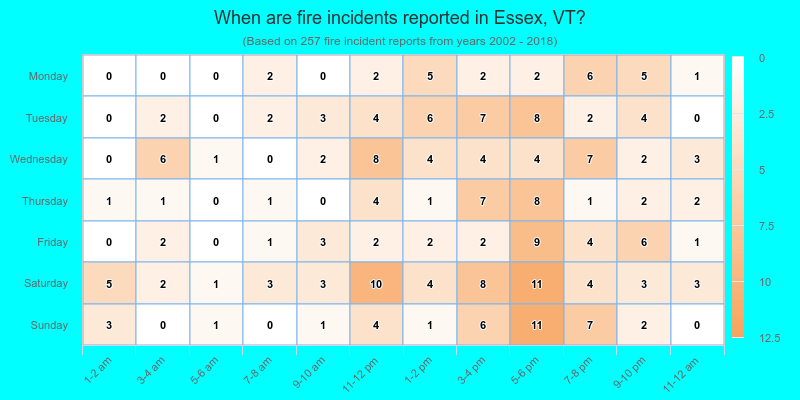
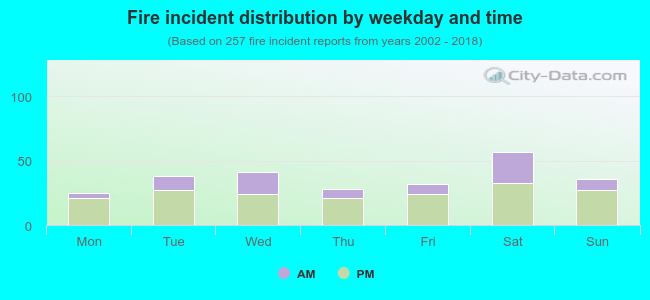 31.1% incidents where reported in the morning and 68.9% in the evening. The most fires (22.2%) took place on Saturday, and the least (9.7%) on Monday.
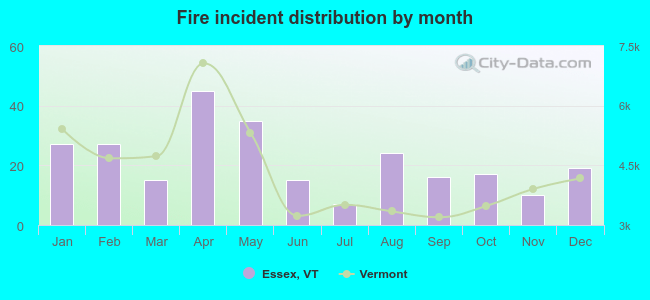 According to the 257 fires from years 2002 - 2018 most fires (17.5%) took place during April, and the least (2.7%) in July.
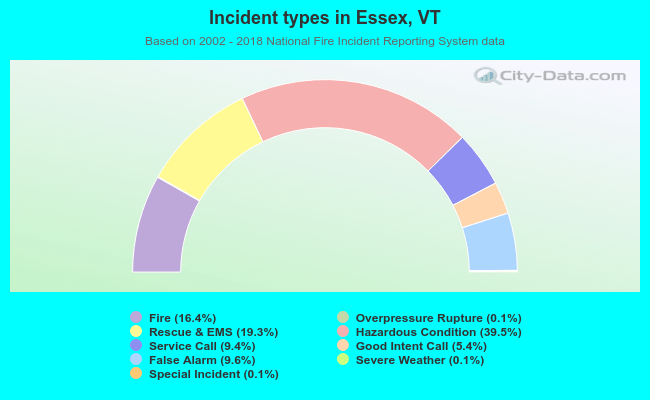 Out of all 1,565 cases reported during the years 2002 - 2018, the most belonged to the categories: Hazardous Condition (39.5%), Rescue & EMS (19.3%), and Fire (16.4%).
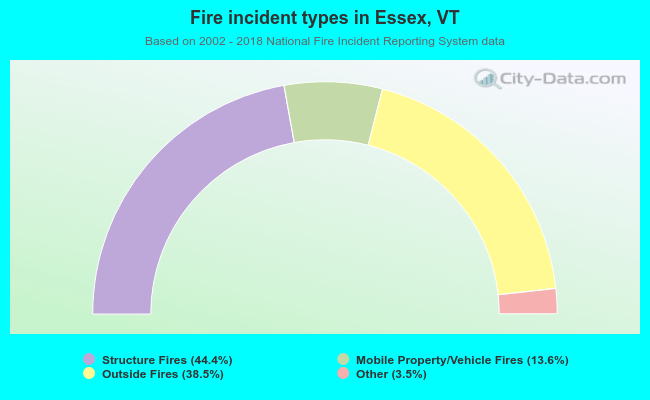 When looking into fire subcategories, the most reports belonged to: Structure Fires (44.4%), and Outside Fires (38.5%).