Evansville: Fire Incidents, Wisconsin (WI)
Where are fire incidents reported in Evansville, WI
Something went wrong! Please refresh the page.
|
| |||||||||||||||||||||||||||||||||||||||||||||||||||||||||||||||||||||||||||||||||||||||||||||||||||||||||||||
2003 - 2018 National Fire Incident Reporting System (NFIRS) incidents
- Incident types reported to NFIRS in Evansville, WI
- 48339.8%Rescue & EMS
- 31726.1%Fire
- 15913.1%Hazardous Condition
- 12110.0%Good Intent Call
- 1008.2%False Alarm
- 282.3%Service Call
- 40.3%Special Incident
- Fire incident types reported to NFIRS in Evansville, WI
- 19561.5%Structure Fires
- 7824.6%Outside Fires
- 3310.4%Mobile Property/Vehicle Fires
- 113.5%Other
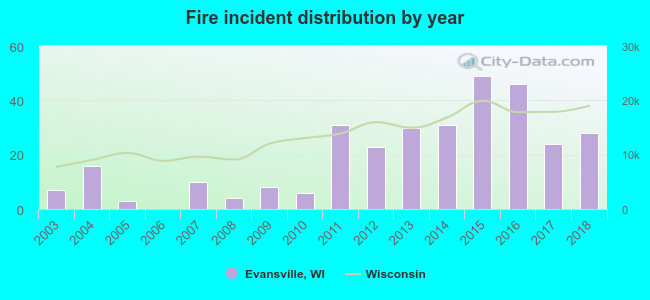 Based on the data from the years 2003 - 2018 the average number of fires per year is 20. The highest number of fires - 49 took place in 2015, and the least - 0 in 2006. The data has a growing trend.
The average number of yearly fire incidents per 10k residents in Evansville, WI compared to nearest cities:
(Note: Based on data for the last 3 years, including only cities with population 5,000 and above)
| Evansville: | 63.1 |
| Stoughton: | 46.8 |
| Oregon: | 24.0 |
| Edgerton: | 45.3 |
| Janesville: | 24.4 |
| McFarland: | 33.0 |
| Fitchburg: | 33.1 |
| Milton: | 71.0 |
| Verona: | 27.8 |
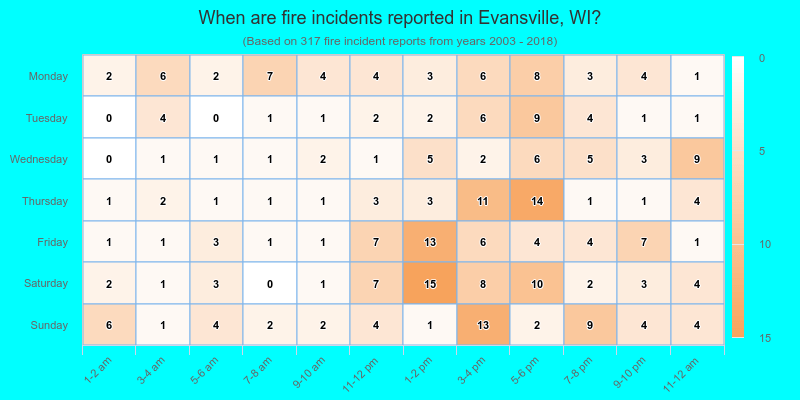
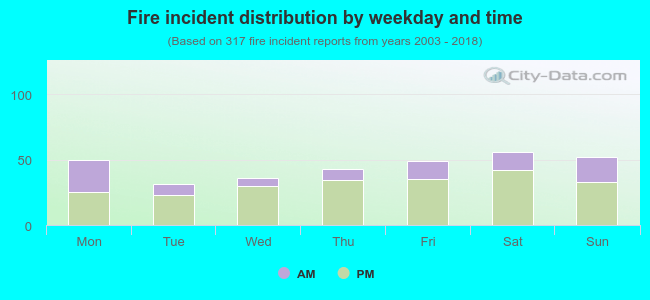 30.0% incidents where reported in the morning and 70.0% in the evening. The most fires (17.7%) took place on Saturday, and the least (9.8%) on Tuesday.
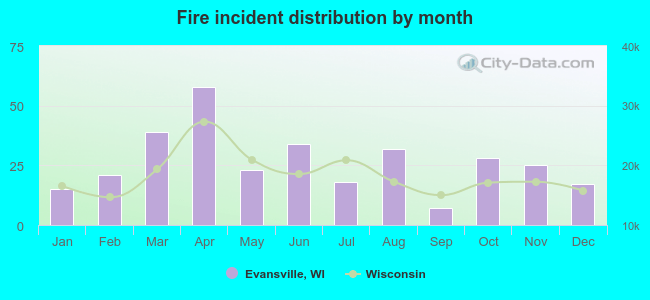 Based on the 317 fire incident reports from years 2003 - 2018 most fires (18.3%) took place during April, and the least (2.2%) in September.
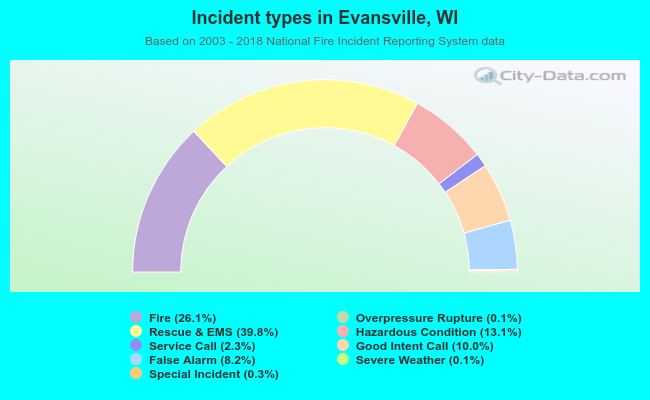 Out of all 1,214 cases reported during the years 2003 - 2018, the most belonged to the categories: Rescue & EMS (39.8%), Fire (26.1%), and Hazardous Condition (13.1%).
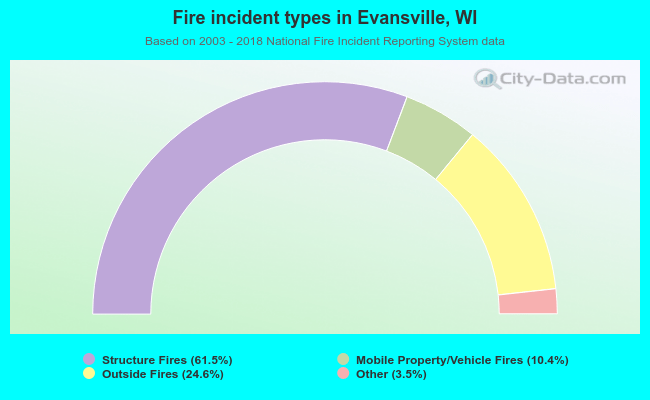 When looking into fire subcategories, the most reports belonged to: Structure Fires (61.5%), and Outside Fires (24.6%).