| Fire incidents reported |
|---|
| Sreet name | Count |
|---|
| TRUAX RD | 14 | | RAILROAD AVE | 10 | | RATTLERS RUN RD | 10 | | TICKNOR ST | 10 | | 208 RAILROAD AVE | 8 | | 2ND ST | 6 | | ADAMS RD | 6 | | CAMERON RD | 6 | | CHAPMAN RD | 6 | | HAYS RD | 6 | | NORTON ST | 6 | | POWERS RD | 6 | | PRAIRIE VIEW RD | 6 | | SPOKANE AVE | 6 | | 1ST ST | 4 | | 202 5TH ST | 4 | | 27212 S.R. 27 | 4 | | GOOD SAMARITAN RD | 4 | | HAMILTON AVE | 4 | | MARCH RD | 4 | | MARSH RD | 4 | | PORTLAND AVE | 4 | | SANDERS RD | 4 | | TRUAX AND MARSH RD | 4 | | VALLEY CHAPEL RD | 4 |
| | | Fire incidents reported |
|---|
| Sreet name | Count |
|---|
| WEST BRADSHAW RD | 4 | | 102 FAIRWEATHER | 2 | | 12200 RATTLERS RUN RD | 2 | | 13800 WEST BRADSHAW RD | 2 | | 14414 PRAIRE VIEW RD | 2 | | 15310 RATTKERS RUN RD | 2 | | 15310 RATTLERS RUN RD | 2 | | 15404 SANDERS RD | 2 | | 16000 RATTLERS RUN RD | 2 | | 17400 VALLEY CHAPEL RD | 2 | | 18600 TRUAX RD | 2 | | 205 4 TH ST | 2 | | 20800 DARKNELL RD | 2 | | 20802 OLD TRUAX RD | 2 | | 213 MAIN ST | 2 | | 21916 E POWERS RD | 2 | | 22000 POWERS RD | 2 | | 22815 TRUAX RD | 2 | | 23519 NORTH KENTUCK TRL | 2 | | 24300 DAVIS RD | 2 | | 26918 TRUAX RD | 2 | | 302 PORTLAND AVE | 2 | | 304 NORTON ST | 2 | | 310 1ST ST | 2 | | |
|
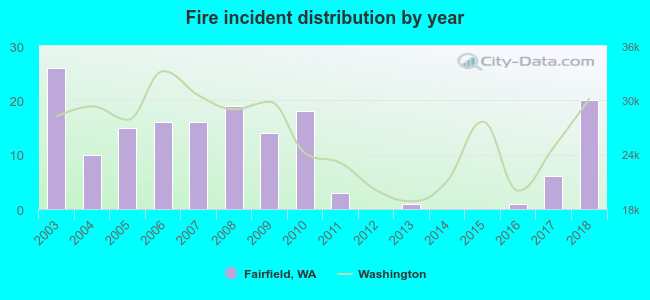 Based on the data from the years 2003 - 2018 the average number of fires per year is 10. The highest number of fires - 26 took place in 2003, and the least - 0 in 2012. The data has a decreasing trend.
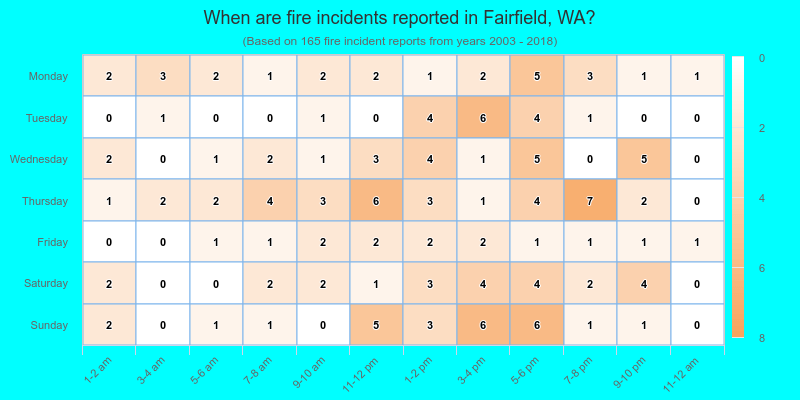
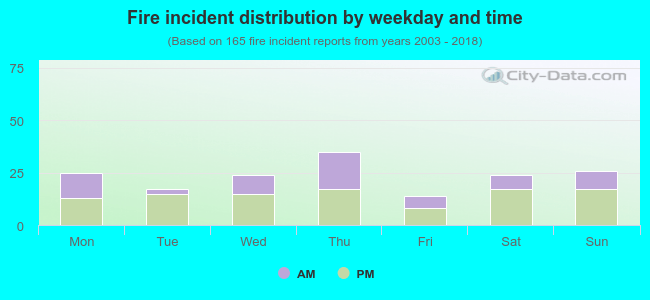 38.2% incidents where reported in the morning and 61.8% in the evening. The most fires (21.2%) took place on Thursday, and the least (8.5%) on Friday.
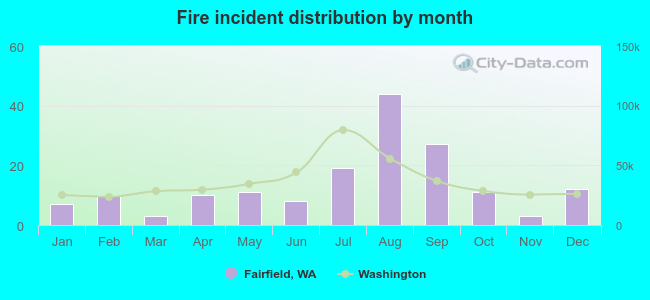 Based on the 165 fires from years 2003 - 2018 most fires (26.7%) took place during August, and the least (1.8%) in March.
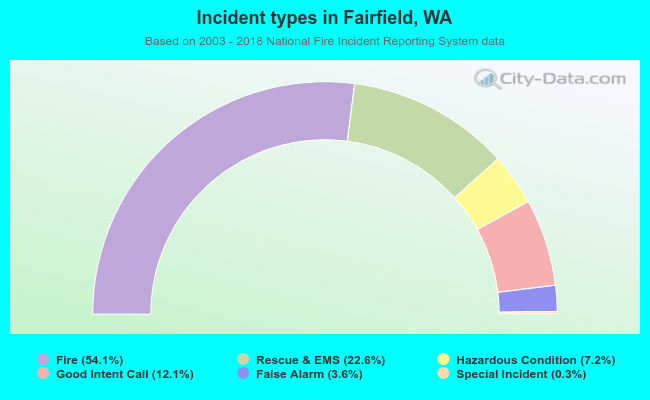 Out of all 305 cases reported during the years 2003 - 2018, the most belonged to the categories: Fire (54.1%), Overpressure Rupture (22.6%), and Hazardous Condition (12.1%).
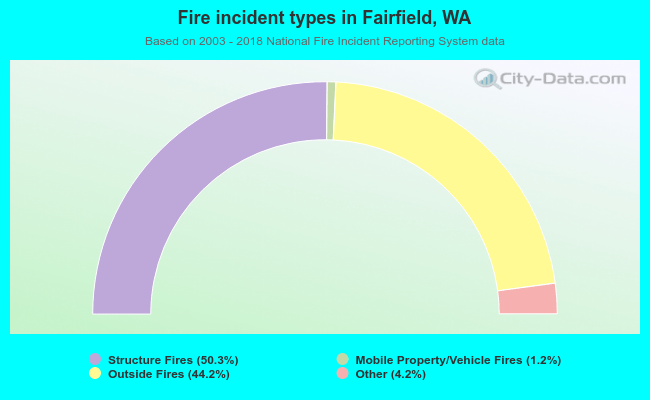 When looking into fire subcategories, the most reports belonged to: Structure Fires (50.3%), and Outside Fires (44.2%).