Falls Church: Fire Incidents, Virginia (VA)
Where are fire incidents reported in Falls Church, VA
Something went wrong! Please refresh the page.
| Fire incidents reported | |
|---|---|
| Sreet name | Count |
| LEESBURG PIKE | 270 |
| SEMINARY RD | 228 |
| ARLINGTON BLVD | 182 |
| BROAD ST | 162 |
| LEE HWY | 138 |
| GALLOWS RD | 112 |
| COLUMBIA PIKE | 96 |
| PATRICK HENRY DR | 78 |
| WASHINGTON ST | 78 |
| SOUTH JEFFERSON ST | 58 |
| SOUTH GEORGE MASON DR | 54 |
| WILSON BLVD | 52 |
| ANNANDALE RD | 50 |
| KNOLLWOOD DR | 50 |
| HAYCOCK RD | 46 |
| CARLIN SPRINGS RD | 40 |
| ARLINGTON BLVD | 38 |
| BARCROFT VIEW TER | 36 |
| GEORGE MASON DR | 36 |
| SOUTH MANCHESTER ST | 36 |
| VISTA DR | 36 |
| ARGYLE DR | 34 |
| LEESBURG PIKE | 32 |
| PARKWOOD CT | 32 |
| PIMMIT DR | 32 |
| FAIRVIEW PARK DR TO I495 NB | 30 |
| WILSON BL | 28 |
| GREENWOOD DR | 26 |
| SEVEN CORNERS CTR | 26 |
| SPRING LN | 26 |
| Other | 550 |
2005 - 2018 National Fire Incident Reporting System (NFIRS) incidents
- Incident types reported to NFIRS in Falls Church, VA
- 28,67762.4%Rescue & EMS
- 5,09511.1%Good Intent Call
- 3,4437.5%Hazardous Condition
- 3,1326.8%False Alarm
- 2,7986.1%Service Call
- 2,6925.9%Fire
- 470.1%Overpressure Rupture
- 470.1%Special Incident
- Fire incident types reported to NFIRS in Falls Church, VA
- 1,49555.5%Structure Fires
- 77328.7%Outside Fires
- 33412.4%Mobile Property/Vehicle Fires
- 903.3%Other
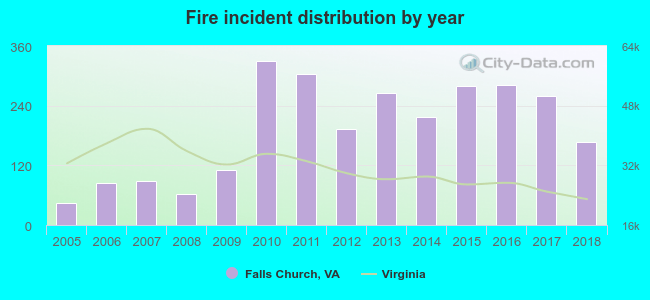 According to the data from the years 2005 - 2018 the average number of fires per year is 192. The highest number of reported fires - 330 took place in 2010, and the least - 44 in 2005. The data has a rising trend.
The average number of yearly fire incidents per 10k residents in Falls Church, VA compared to nearest cities:
(Note: Based on data for the last 3 years, including only cities with population 5,000 and above)
| Falls Church: | 173.3 |
| Jefferson: | 1.1 |
| Idylwood: | 6.9 |
| Seven Corners: | 15.1 |
| Dunn Loring: | 5.7 |
| McLean: | 19.5 |
| Arlington: | 17.1 |
| Merrifield: | 1.1 |
| Annandale: | 25.5 |
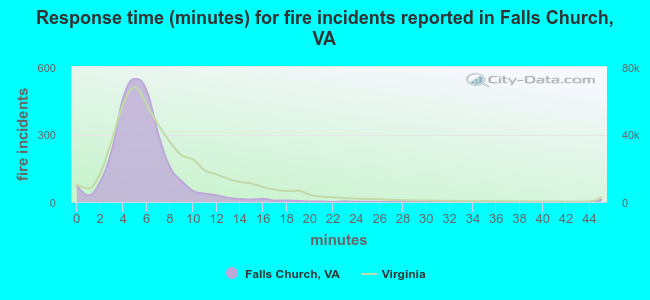 The median response time based on all reported fire incidents is 5 minutes. This is lower compared to the state median value.
The median response time in Falls Church, VA compared to nearest cities:
(Note: Based on data for all years, including only cities with at least 500 fire incidents)
| Falls Church: | 5 minutes |
| McLean: | 6 minutes |
| Arlington: | 5 minutes |
| Annandale: | 5 minutes |
| Vienna: | 5 minutes |
| Springfield: | 6 minutes |
| Fairfax: | 6 minutes |
| Alexandria: | 5 minutes |
| Bethesda: | 5 minutes |
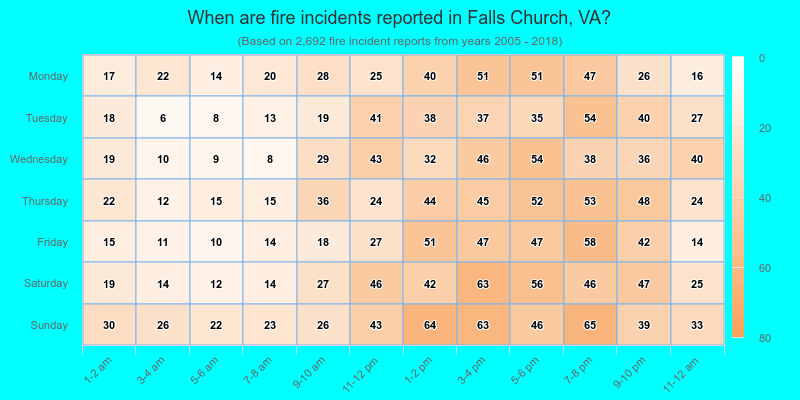
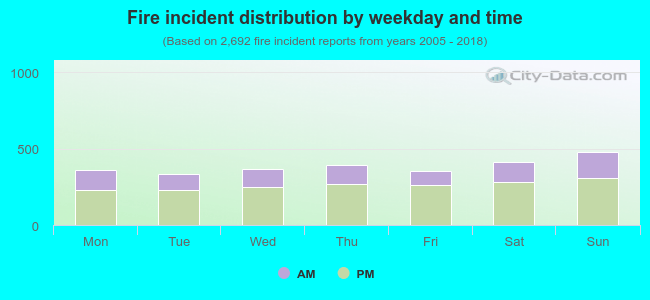 32.3% incidents where reported in the morning and 67.7% in the evening. The most fires (17.8%) took place on Sunday, and the least (12.5%) on Tuesday.
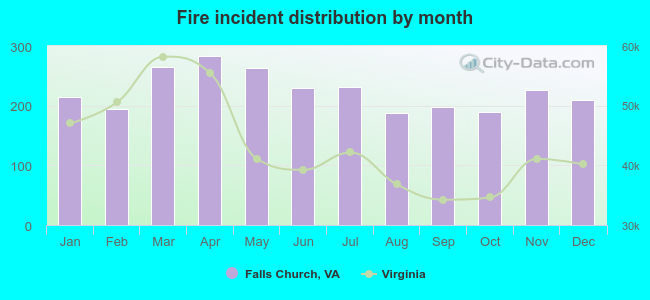 Based on the 2,692 incident reports from years 2005 - 2018 most fires (10.5%) took place during April, and the least (6.9%) in August.
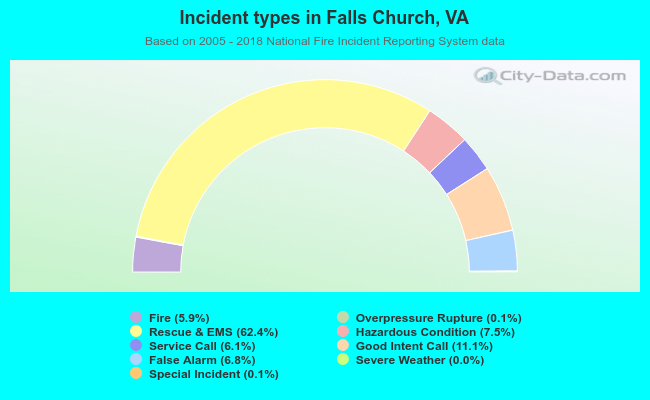 Out of all 45,948 cases reported during the years 2005 - 2018, the most belonged to the categories: Rescue & EMS (62.4%), Good Intent Call (11.1%), and Hazardous Condition (7.5%).
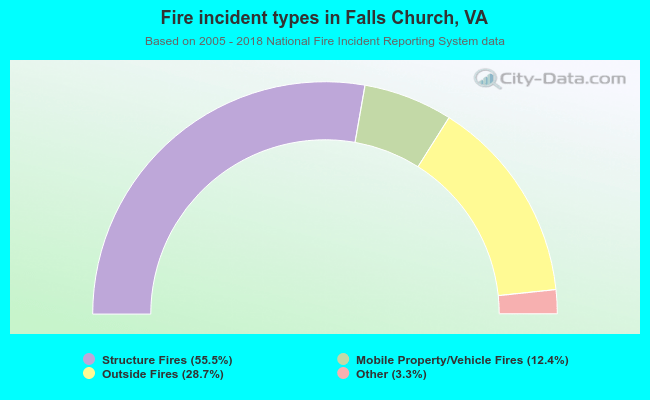 When looking into fire subcategories, the most reports belonged to: Structure Fires (55.5%), and Outside Fires (28.7%).