Fellsmere: Fire Incidents, Florida (FL)
Where are fire incidents reported in Fellsmere, FL
Something went wrong! Please refresh the page.
|
| |||||||||||||||||||||||||||||||||||||||||||||||||||||||||||||||||||||||||||||||||||||||||||||||||||||||||||||
2002 - 2018 National Fire Incident Reporting System (NFIRS) incidents
- Incident types reported to NFIRS in Fellsmere, FL
- 1,94452.0%Rescue & EMS
- 53014.2%Fire
- 52414.0%Good Intent Call
- 46612.5%Hazardous Condition
- 1574.2%False Alarm
- 1032.8%Service Call
- 70.2%Special Incident
- Fire incident types reported to NFIRS in Fellsmere, FL
- 38171.9%Outside Fires
- 8716.4%Mobile Property/Vehicle Fires
- 5810.9%Structure Fires
- 40.8%Other
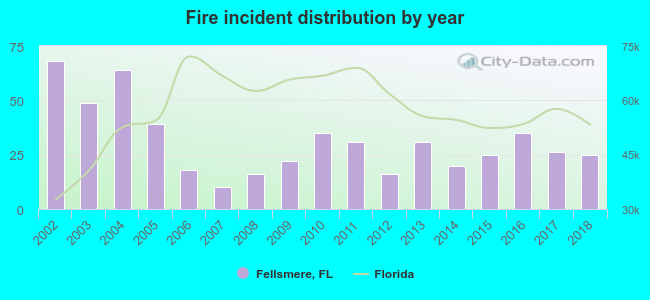 According to the data from the years 2002 - 2018 the average number of fires per year is 31. The highest number of reported fires - 68 took place in 2002, and the least - 10 in 2007. The data has a declining trend.
The average number of yearly fire incidents per 10k residents in Fellsmere, FL compared to nearest cities:
(Note: Based on data for the last 3 years, including only cities with population 5,000 and above)
| Fellsmere: | 52.7 |
| Sebastian: | 27.4 |
| Micco: | 28.0 |
| Vero Beach: | 238.7 |
| Palm Bay: | 33.4 |
| West Melbourne: | 38.0 |
| Melbourne: | 26.1 |
| Indian Harbour Beach: | 12.8 |
| Fort Pierce: | 123.2 |
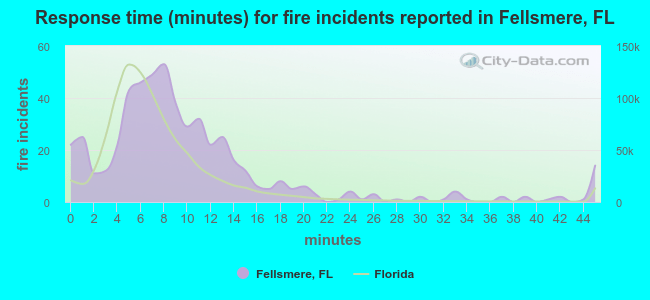 The median response time based on all reported fire incidents is 8 minutes. This is higher compared to the state median value.
The median response time in Fellsmere, FL compared to nearest cities:
(Note: Based on data for all years, including only cities with at least 500 fire incidents)
| Fellsmere: | 8 minutes |
| Sebastian: | 8 minutes |
| Vero Beach: | 8 minutes |
| Palm Bay: | 7 minutes |
| Malabar: | 6 minutes |
| West Melbourne: | 7 minutes |
| Melbourne: | 5 minutes |
| Fort Pierce: | 9 minutes |
| Satellite Beach: | 5 minutes |
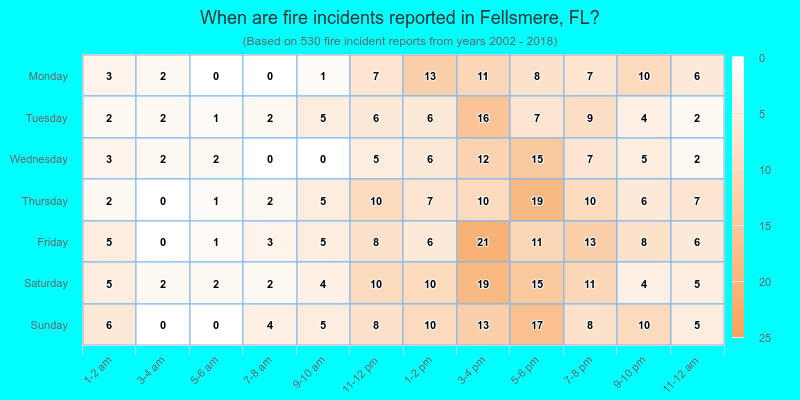
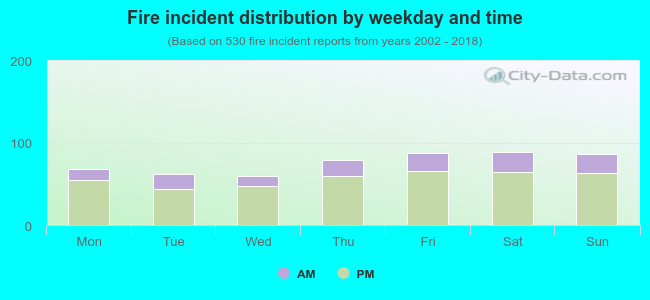 25.1% incidents where reported in the morning and 74.9% in the evening. The most fires (16.8%) took place on Saturday, and the least (11.1%) on Wednesday.
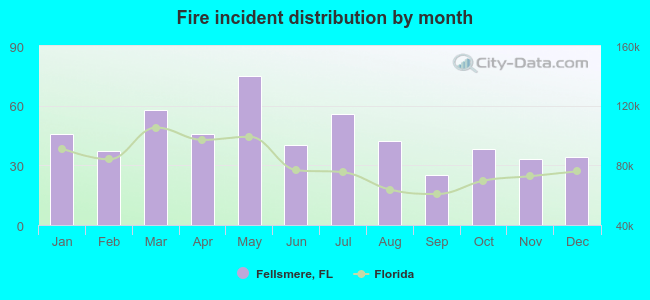 According to the 530 fires from years 2002 - 2018 most fires (14.2%) took place during May, and the least (4.7%) in September.
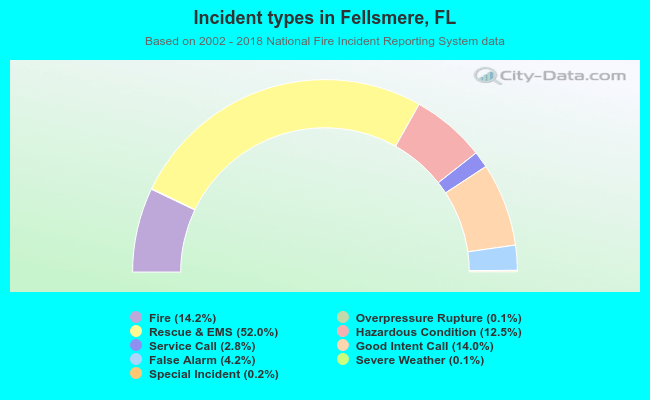 Out of all 3,736 cases reported during the years 2002 - 2018, the most belonged to the categories: Rescue & EMS (52.0%), Fire (14.2%), and Good Intent Call (14.0%).
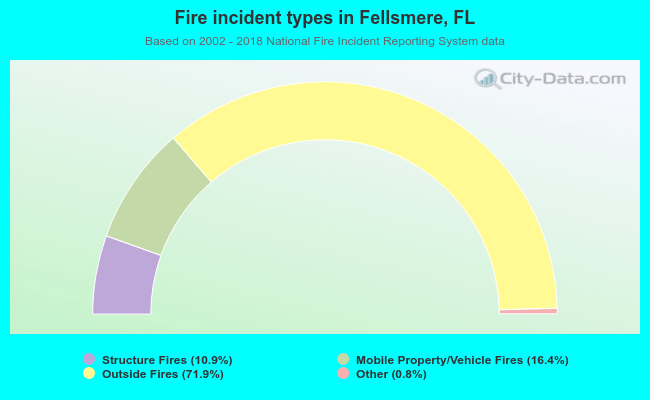 When looking into fire subcategories, the most reports belonged to: Outside Fires (71.9%), and Mobile Property/Vehicle Fires (16.4%).