Folly Beach: Fire Incidents, South Carolina (SC)
Where are fire incidents reported in Folly Beach, SC
Something went wrong! Please refresh the page.
|
| |||||||||||||||||||||||||||||||||||||||||||||||||||||||||||||||||||||||||||||||||||||||||||||||||||||||||||||
2002 - 2018 National Fire Incident Reporting System (NFIRS) incidents
- Incident types reported to NFIRS in Folly Beach, SC
- 1,73855.4%Rescue & EMS
- 34210.9%Service Call
- 32310.3%Hazardous Condition
- 2778.8%Fire
- 2748.7%Good Intent Call
- 1715.4%False Alarm
- 90.3%Severe Weather
- Fire incident types reported to NFIRS in Folly Beach, SC
- 11742.2%Outside Fires
- 11140.1%Structure Fires
- 4315.5%Mobile Property/Vehicle Fires
- 62.2%Other
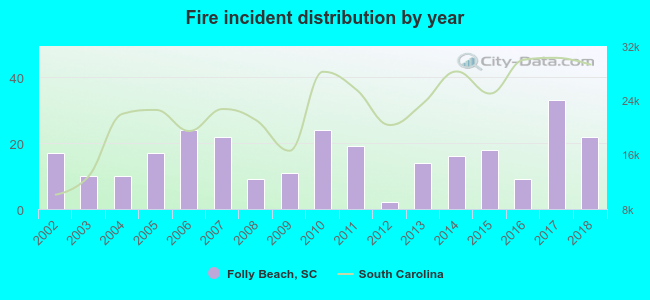 According to the data from the years 2002 - 2018 the average number of fires per year is 16. The highest number of reported fires - 33 took place in 2017, and the least - 2 in 2012. The data has an increasing trend.
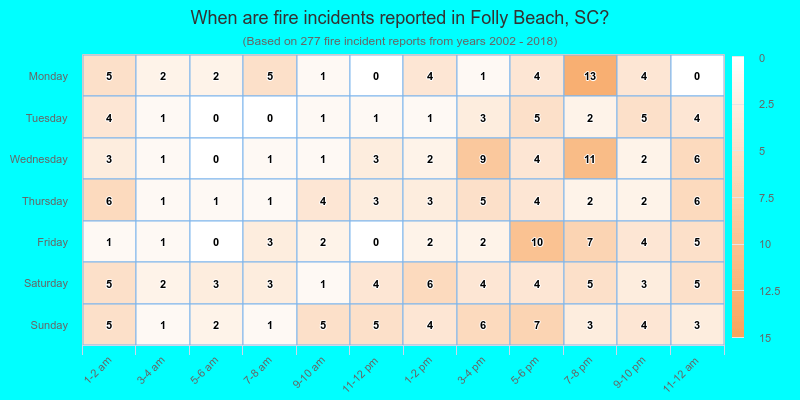
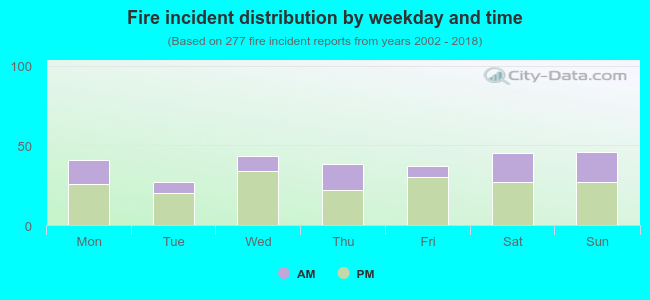 32.9% incidents where reported in the morning and 67.1% in the evening. The most fires (16.6%) took place on Sunday, and the least (9.7%) on Tuesday.
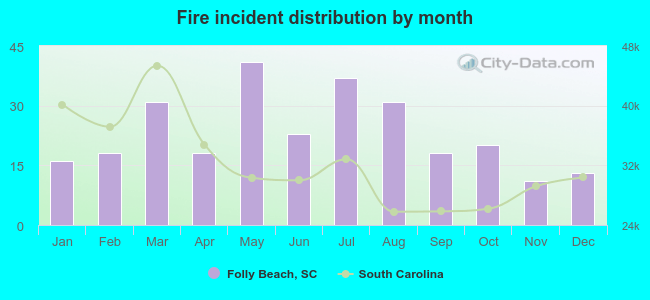 Based on the 277 fire incident reports from years 2002 - 2018 most fires (14.8%) took place during May, and the least (4.0%) in November.
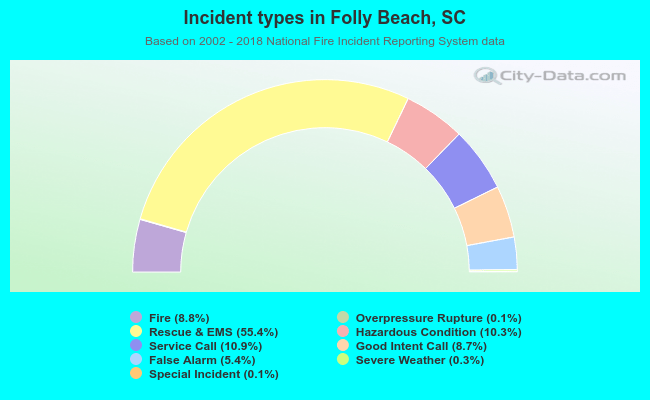 Out of all 3,140 cases reported during the years 2002 - 2018, the most belonged to the categories: Rescue & EMS (55.4%), Service Call (10.9%), and Hazardous Condition (10.3%).
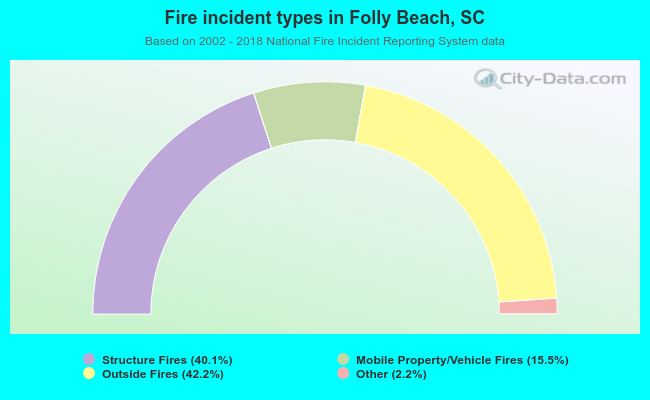 When looking into fire subcategories, the most reports belonged to: Outside Fires (42.2%), and Structure Fires (40.1%).