Fontana: Fire Incidents, California (CA)
Where are fire incidents reported in Fontana, CA
Something went wrong! Please refresh the page.
| Fire incidents reported | |
|---|---|
| Sreet name | Count |
| SIERRA AVE | 80 |
| FOOTHILL BLVD | 66 |
| SLOVER AVE | 64 |
| VALLEY BLVD | 58 |
| CHERRY AVE | 54 |
| CITRUS AVE | 50 |
| STATE 210 FWY | 48 |
| JURUPA AVE | 38 |
| MERRILL AVE | 36 |
| ARROW BLVD | 34 |
| RANDALL AVE | 34 |
| I10 EB OFR AT CHERRY | 30 |
| JUNIPER AVE | 28 |
| LIVE OAK AVE | 28 |
| ARROW RTE | 26 |
| MANGO AVE | 26 |
| CERES AVE | 24 |
| BASELINE RD | 20 |
| BOYLE AVE | 20 |
| ELM AVE | 20 |
| OLEANDER AVE | 20 |
| PALMETTO AVE | 20 |
| SAN BERNARDINO AVE | 20 |
| SIERRA LAKES PKY | 20 |
| VALENCIA AVE | 20 |
| ALDER AVE | 18 |
| CATAWBA AVE | 18 |
| SANTA ANA AVE | 18 |
| SULTANA AVE | 18 |
| SUMMIT AVE | 18 |
| Other | 488 |
2005 - 2018 National Fire Incident Reporting System (NFIRS) incidents
- Incident types reported to NFIRS in Fontana, CA
- 19,16468.2%Rescue & EMS
- 4,85617.3%Good Intent Call
- 1,4625.2%Fire
- 1,0943.9%Service Call
- 7892.8%Hazardous Condition
- 6932.5%False Alarm
- Fire incident types reported to NFIRS in Fontana, CA
- 57139.1%Outside Fires
- 45431.1%Structure Fires
- 38526.3%Mobile Property/Vehicle Fires
- 523.6%Other
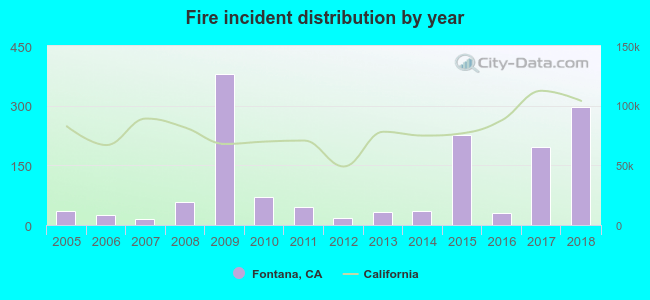 According to the data from the years 2005 - 2018 the average number of fire incidents per year is 104. The highest number of reported fire incidents - 379 took place in 2009, and the least - 16 in 2007. The data has an increasing trend.
The average number of yearly fire incidents per 10k residents in Fontana, CA compared to nearest cities:
(Note: Based on data for the last 3 years, including only cities with population 5,000 and above)
| Fontana: | 8.5 |
| Bloomington: | 11.2 |
| Rialto: | 4.3 |
| Rancho Cucamonga: | 13.9 |
| Jurupa: | 0.1 |
| Rubidoux: | 1.3 |
| Muscoy: | 21.0 |
| Colton: | 60.0 |
| Grand Terrace: | 8.3 |
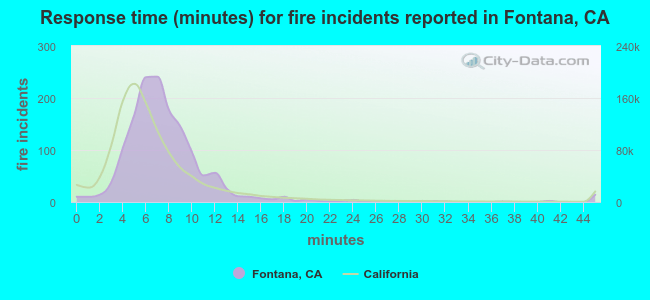 The median response time based on all reported fire incidents is 7 minutes. This is about the same as the California median value.
The median response time in Fontana, CA compared to nearest cities:
(Note: Based on data for all years, including only cities with at least 500 fire incidents)
| Fontana: | 7 minutes |
| Rialto: | 8 minutes |
| Rancho Cucamonga: | 7 minutes |
| Colton: | 7 minutes |
| San Bernardino: | 7 minutes |
| Ontario: | 6 minutes |
| Riverside: | 6 minutes |
| Loma Linda: | 6 minutes |
| Montclair: | 6 minutes |
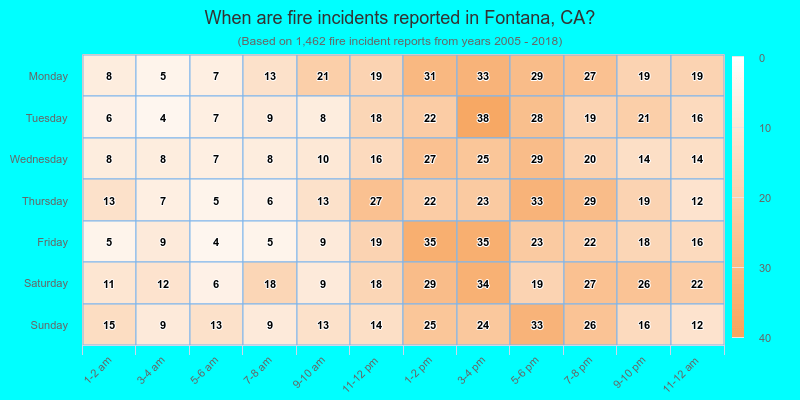
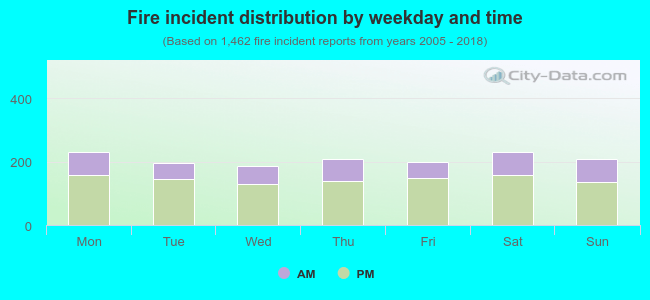 30.8% incidents where reported in the morning and 69.2% in the evening. The most fires (15.8%) took place on Monday, and the least (12.7%) on Wednesday.
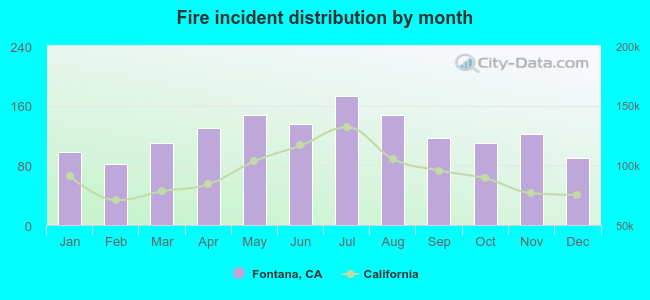 Based on the 1,462 fires from years 2005 - 2018 most fires (11.8%) took place during July, and the least (5.6%) in February.
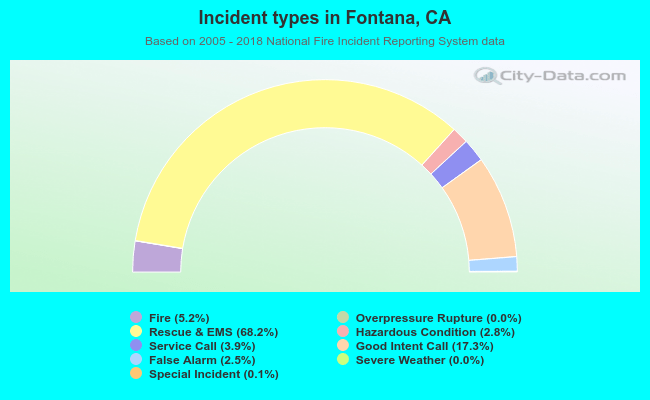 Out of all 28,095 cases reported during the years 2005 - 2018, the most belonged to the categories: Rescue & EMS (68.2%), Good Intent Call (17.3%), and Fire (5.2%).
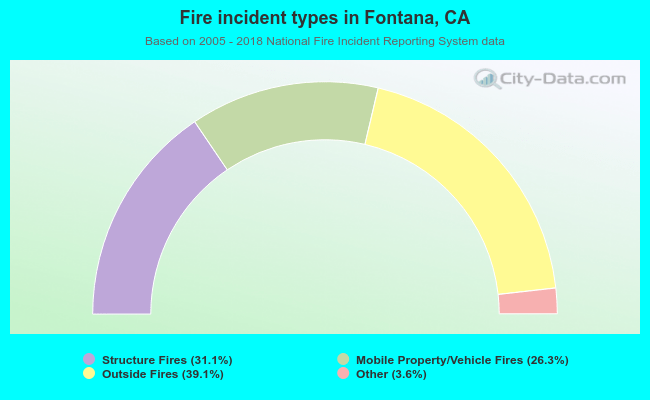 When looking into fire subcategories, the most reports belonged to: Outside Fires (39.1%), and Structure Fires (31.1%).