Forney: Fire Incidents, Texas (TX)
Where are fire incidents reported in Forney, TX
Something went wrong! Please refresh the page.
|
| |||||||||||||||||||||||||||||||||||||||||||||||||||||||||||||||||||||||||||||||||||||||||||||||||||||||||||||
| Other | 270 | |||||||||||||||||||||||||||||||||||||||||||||||||||||||||||||||||||||||||||||||||||||||||||||||||||||||||||||
2004 - 2018 National Fire Incident Reporting System (NFIRS) incidents
- Incident types reported to NFIRS in Forney, TX
- 6,09048.5%Rescue & EMS
- 1,77814.1%Good Intent Call
- 1,61612.9%Fire
- 1,26510.1%Service Call
- 1,1038.8%Hazardous Condition
- 6805.4%False Alarm
- 130.1%Special Incident
- Fire incident types reported to NFIRS in Forney, TX
- 95559.1%Outside Fires
- 31819.7%Structure Fires
- 22313.8%Mobile Property/Vehicle Fires
- 1207.4%Other
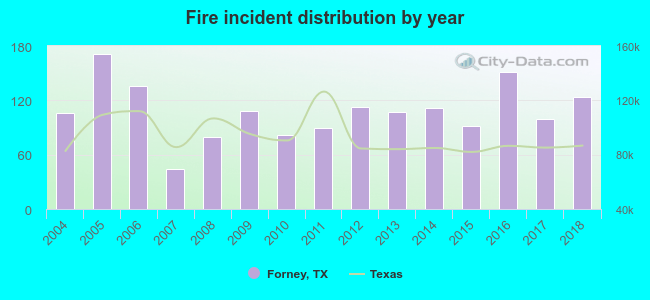 According to the data from the years 2004 - 2018 the average number of fire incidents per year is 108. The highest number of reported fire incidents - 171 took place in 2005, and the least - 44 in 2007. The data has an increasing trend.
The average number of yearly fire incidents per 10k residents in Forney, TX compared to nearest cities:
(Note: Based on data for the last 3 years, including only cities with population 5,000 and above)
| Forney: | 71.1 |
| Heath: | 31.3 |
| Sunnyvale: | 56.1 |
| Seagoville: | 51.3 |
| Mesquite: | 31.4 |
| Balch Springs: | 39.0 |
| Terrell: | 100.4 |
| Rockwall: | 23.0 |
| Rowlett: | 17.9 |
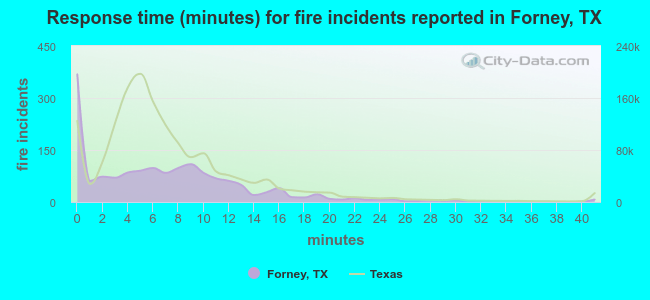 The median response time based on all reported fire incidents is 6 minutes. This is comparable to the state median value.
The median response time in Forney, TX compared to nearest cities:
(Note: Based on data for all years, including only cities with at least 500 fire incidents)
| Forney: | 6 minutes |
| Seagoville: | 5 minutes |
| Mesquite: | 5 minutes |
| Crandall: | 8 minutes |
| Balch Springs: | 5 minutes |
| Terrell: | 9 minutes |
| Rockwall: | 5 minutes |
| Rowlett: | 6 minutes |
| Fate: | 8 minutes |
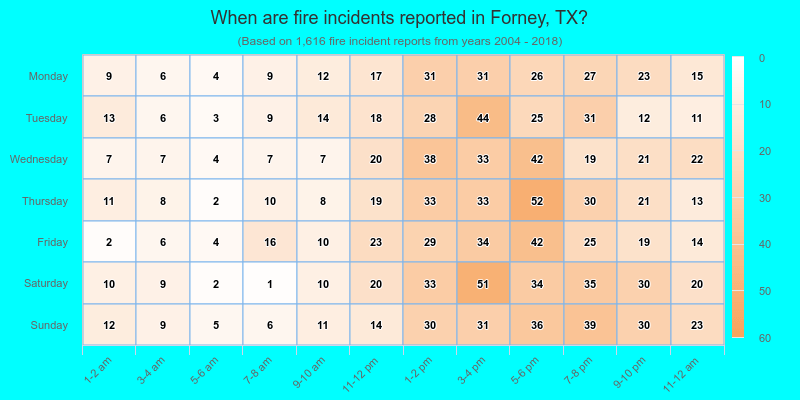
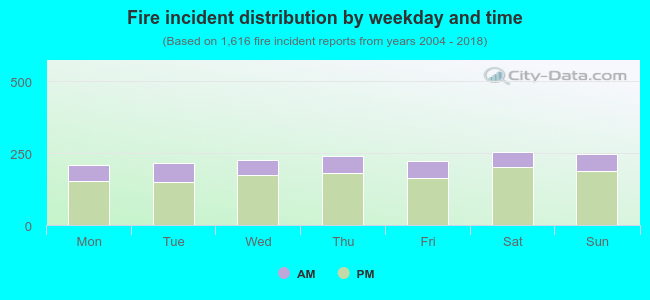 24.8% incidents where reported in the morning and 75.2% in the evening. The most fires (15.8%) took place on Saturday, and the least (13.0%) on Monday.
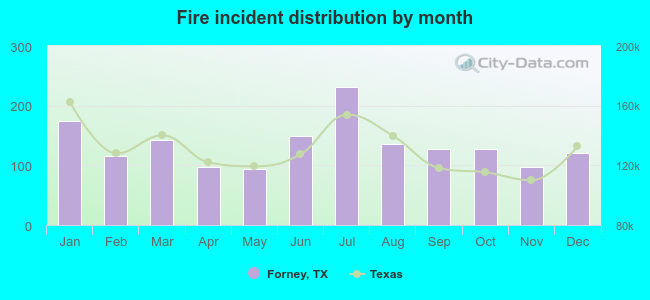 According to the 1,616 fire incident reports from years 2004 - 2018 most fires (14.4%) took place during July, and the least (5.8%) in May.
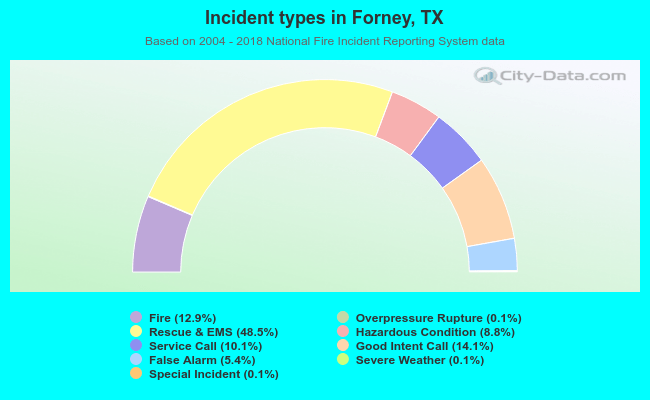 Out of all 12,566 cases reported during the years 2004 - 2018, the most belonged to the categories: Rescue & EMS (48.5%), Good Intent Call (14.1%), and Fire (12.9%).
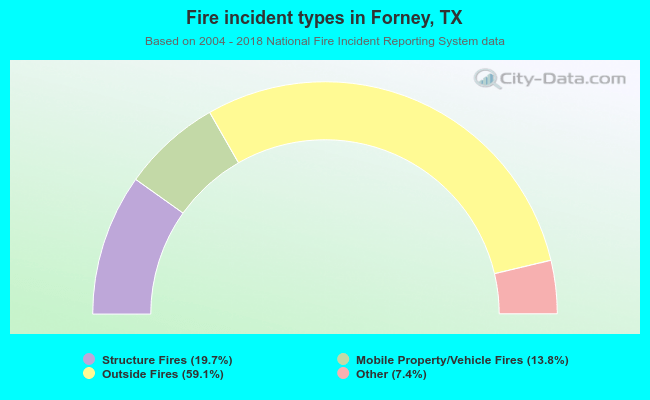 When looking into fire subcategories, the most incidents belonged to: Outside Fires (59.1%), and Structure Fires (19.7%).