Fort Smith: Fire Incidents, Arkansas (AR)
Where are fire incidents reported in Fort Smith, AR
Something went wrong! Please refresh the page.
| Fire incidents reported | |
|---|---|
| Sreet name | Count |
| ROGERS AVE | 454 |
| TOWSON AVE | 268 |
| ZERO ST | 248 |
| KINKEAD AVE | 228 |
| MIDLAND BLVD | 226 |
| 6 ST | 210 |
| MAHOGANY AVE | 202 |
| GRAND AVE | 170 |
| JENNY LIND RD | 150 |
| WINTERGREEN AVE | 148 |
| WHEELER AVE | 132 |
| 12 ST | 122 |
| 271 HWY | 122 |
| PHOENIX AVE | 122 |
| 31 ST | 118 |
| 17 ST | 110 |
| GREENWOOD AVE | 102 |
| DALLAS ST | 98 |
| MASSARD RD | 98 |
| 71 HWY | 96 |
| KELLEY HWY | 96 |
| 14 ST | 92 |
| ALBERT PIKE AVE | 90 |
| 11 ST | 86 |
| 18 ST | 84 |
| OLD GREENWOOD RD | 84 |
| 28 ST | 82 |
| 32 ST | 80 |
| 50 ST | 80 |
| GARRISON AVE | 80 |
| Other | 2,243 |
2002 - 2018 National Fire Incident Reporting System (NFIRS) incidents
- Incident types reported to NFIRS in Fort Smith, AR
- 32,00256.9%Rescue & EMS
- 6,52111.6%Fire
- 6,16511.0%Good Intent Call
- 4,7028.4%Hazardous Condition
- 4,1927.4%Service Call
- 2,6254.7%False Alarm
- Fire incident types reported to NFIRS in Fort Smith, AR
- 2,69641.3%Structure Fires
- 2,52738.8%Outside Fires
- 1,13817.5%Mobile Property/Vehicle Fires
- 1602.5%Other
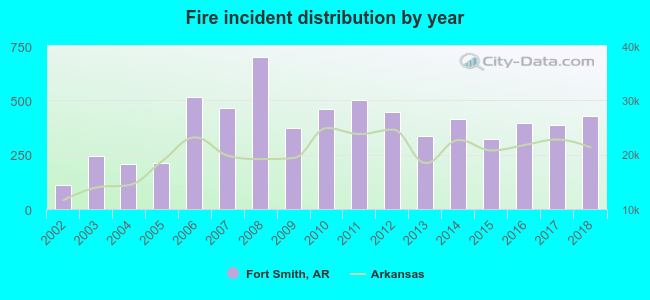 Based on the data from the years 2002 - 2018 the average number of fires per year is 384. The highest number of fire incidents - 700 took place in 2008, and the least - 109 in 2002. The data has an increasing trend.
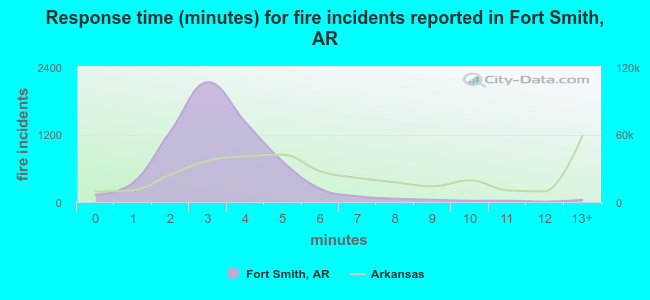 The median response time based on all reported fire incidents is 3 minutes. This is much lower compared to the Arkansas median value.
The median response time in Fort Smith, AR compared to nearest cities:
(Note: Based on data for all years, including only cities with at least 500 fire incidents)
| Fort Smith: | 3 minutes |
| Van Buren: | 5 minutes |
| Lavaca: | 6 minutes |
| Alma: | 8 minutes |
| Greenwood: | 8 minutes |
| Charleston: | 8 minutes |
| Mulberry: | 9 minutes |
| Mountainburg: | 11 minutes |
| Mansfield: | 9 minutes |
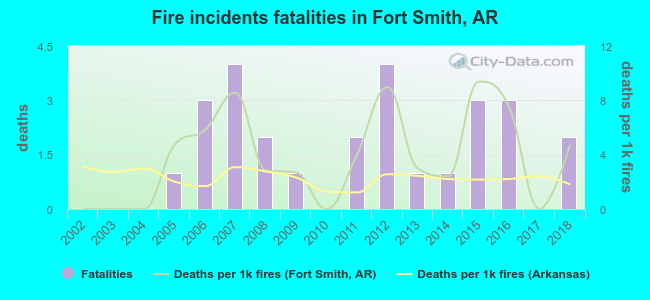 Based on the data from the years 2002 - 2018 the average number of fire-related yearly deaths is 2. The highest number of deaths - 4 took place in 2007, and the lowest - 0 in 2002. The data has an increasing trend.
The average number of fatalities per 1,000 fires is 4. This indicator was the highest - 9 in 2015, and the lowest 0 in 2002. The trend for deaths per 1,000 fire incidents is growing. Compared to the Arkansas value the number of fatalities per 1,000 fire incidents is higher.
Based on the data from the years 2002 - 2018 the average number of fire-related yearly deaths is 2. The highest number of deaths - 4 took place in 2007, and the lowest - 0 in 2002. The data has an increasing trend.
The average number of fatalities per 1,000 fires is 4. This indicator was the highest - 9 in 2015, and the lowest 0 in 2002. The trend for deaths per 1,000 fire incidents is growing. Compared to the Arkansas value the number of fatalities per 1,000 fire incidents is higher.Deaths per 1,000 incidents in Fort Smith, AR compared to nearest cities:
(Note: Based on data for all years, including only cities with at least 2,500 fire incidents)
| Fort Smith: | 4.1 |
| Van Buren: | 1.0 |
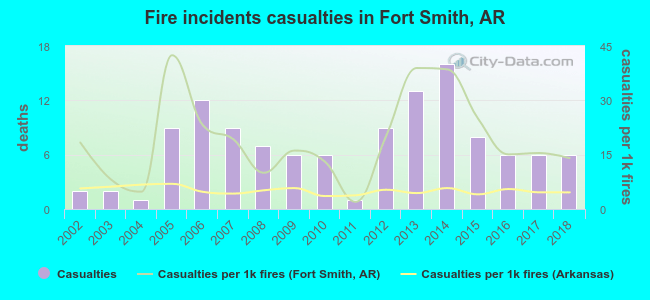 According to the data from the years 2002 - 2018 the average number of fire-related yearly casualties is 7. The highest number of reported injuries - 16 took place in 2014, and the lowest - 1 in 2004. The data has a growing trend.
The average number of injuries per 1,000 fires is 19. This indicator was the highest - 42 in 2005, and the lowest 2 in 2011. The trend for injuries per 1,000 fire incidents is decreasing. Compared to the Arkansas value the number of injuries per 1,000 incidents is much higher.
According to the data from the years 2002 - 2018 the average number of fire-related yearly casualties is 7. The highest number of reported injuries - 16 took place in 2014, and the lowest - 1 in 2004. The data has a growing trend.
The average number of injuries per 1,000 fires is 19. This indicator was the highest - 42 in 2005, and the lowest 2 in 2011. The trend for injuries per 1,000 fire incidents is decreasing. Compared to the Arkansas value the number of injuries per 1,000 incidents is much higher.Casualties per 1,000 incidents in Fort Smith, AR compared to nearest cities:
(Note: Based on data for all years, including only cities with at least 500 fire incidents)
| Fort Smith: | 18.2 |
| Van Buren: | 1.9 |
| Lavaca: | 0.0 |
| Alma: | 1.8 |
| Greenwood: | 1.8 |
| Charleston: | 0.0 |
| Mulberry: | 5.7 |
| Mountainburg: | 3.8 |
| Mansfield: | 0.0 |
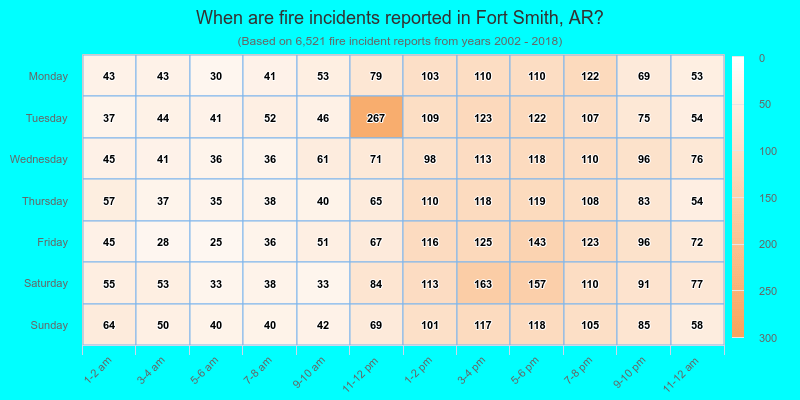
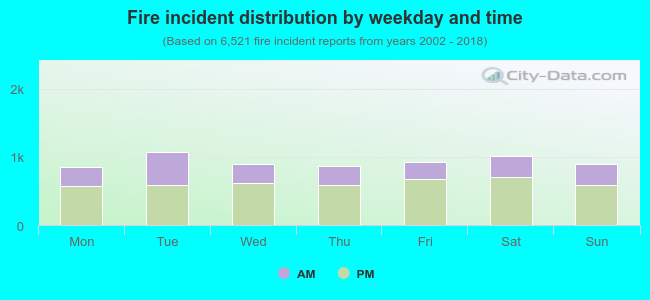 33.6% incidents where reported in the morning and 66.4% in the evening. The most fires (16.5%) took place on Tuesday, and the least (13.1%) on Monday.
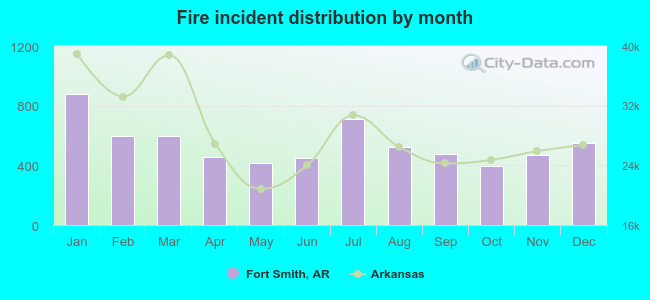 Based on the 6,521 fires from years 2002 - 2018 most fires (13.4%) took place during January, and the least (6.1%) in October.
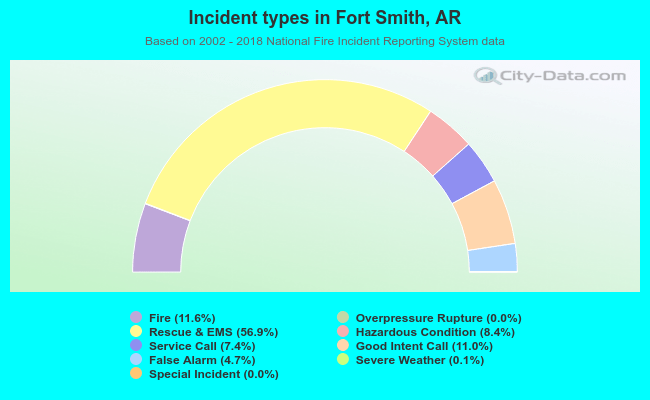 Out of all 56,274 cases reported during the years 2002 - 2018, the most belonged to the categories: Rescue & EMS (56.9%), Fire (11.6%), and Good Intent Call (11.0%).
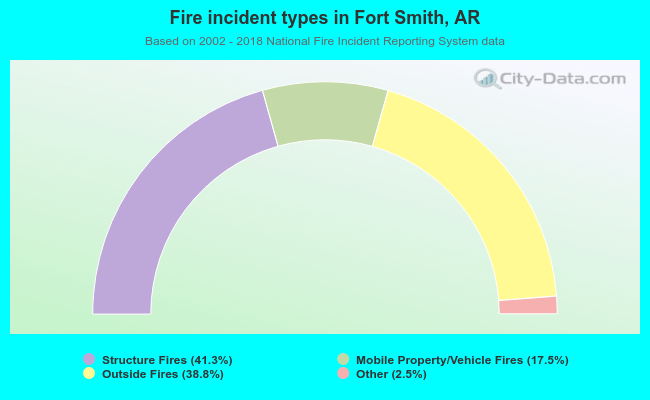 When looking into fire subcategories, the most reports belonged to: Structure Fires (41.3%), and Outside Fires (38.8%).