Franklin Park: Fire Incidents, Illinois (IL)
Where are fire incidents reported in Franklin Park, IL
Something went wrong! Please refresh the page.
| Fire incidents reported | |
|---|---|
| Sreet name | Count |
| FRANKLIN AVE | 270 |
| GRAND AVE | 252 |
| MANNHEIM RD | 198 |
| ROSE ST | 114 |
| BELMONT AVE | 102 |
| CHESTNUT | 90 |
| PACIFIC AVE | 54 |
| MAPLE ST | 52 |
| ELDER LA | 48 |
| FRANKLIN | 48 |
| KING AVE | 48 |
| SCOTT ST | 44 |
| CALWAGNER ST | 42 |
| HAWTHORNE ST | 40 |
| IRVING PARK RD | 38 |
| RIVER RD | 38 |
| LINCOLN ST | 36 |
| SARAH ST | 34 |
| WOLF RD | 34 |
| CROWN RD | 32 |
| WILLOW ST | 32 |
| ADDISON AVE | 30 |
| COMMERCE | 30 |
| DORA ST | 30 |
| ERNST ST | 30 |
| FULLERTON AVE | 30 |
| LOUIS ST | 30 |
| MANNHEIM | 30 |
| MT PROSPECT RD | 30 |
| RUBY ST | 30 |
2002 - 2018 National Fire Incident Reporting System (NFIRS) incidents
- Incident types reported to NFIRS in Franklin Park, IL
- 11,11549.9%Rescue & EMS
- 4,94122.2%False Alarm
- 2,56511.5%Hazardous Condition
- 1,6907.6%Fire
- 9714.4%Service Call
- 9174.1%Good Intent Call
- 580.3%Special Incident
- 250.1%Severe Weather
- Fire incident types reported to NFIRS in Franklin Park, IL
- 89452.9%Structure Fires
- 36421.5%Outside Fires
- 29117.2%Mobile Property/Vehicle Fires
- 1418.3%Other
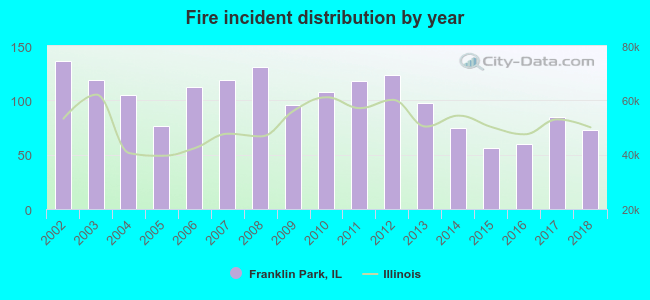 According to the data from the years 2002 - 2018 the average number of fire incidents per year is 99. The highest number of fires - 136 took place in 2002, and the least - 56 in 2015. The data has a declining trend.
The average number of yearly fire incidents per 10k residents in Franklin Park, IL compared to nearest cities:
(Note: Based on data for the last 3 years, including only cities with population 5,000 and above)
| Franklin Park: | 39.5 |
| Schiller Park: | 49.5 |
| River Grove: | 29.2 |
| Northlake: | 33.7 |
| Melrose Park: | 35.1 |
| Elmwood Park: | 26.3 |
| Norridge: | 11.8 |
| Bellwood: | 43.3 |
| Berkeley: | 82.2 |
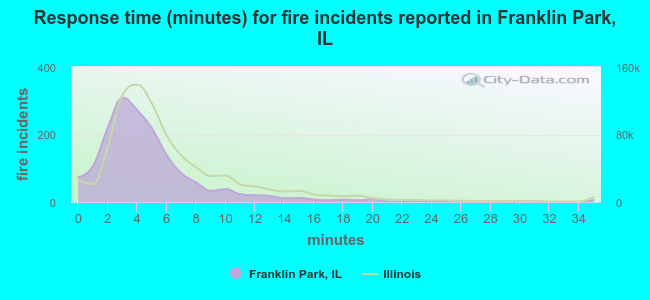 The median response time based on all reported fire incidents is 4 minutes. This is lower compared to the Illinois median value.
The median response time in Franklin Park, IL compared to nearest cities:
(Note: Based on data for all years, including only cities with at least 500 fire incidents)
| Franklin Park: | 4 minutes |
| Schiller Park: | 4 minutes |
| River Grove: | 4 minutes |
| Northlake: | 5 minutes |
| Melrose Park: | 4 minutes |
| Elmwood Park: | 5 minutes |
| Bellwood: | 3 minutes |
| Berkeley: | 4 minutes |
| Maywood: | 3 minutes |
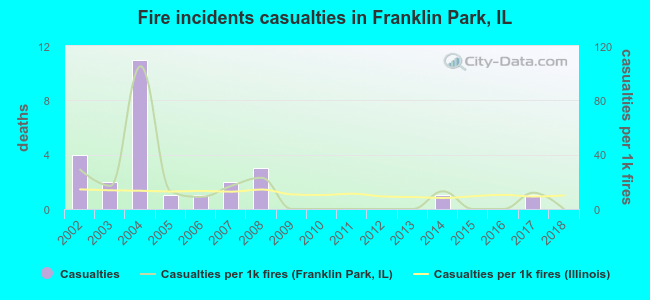 Based on the data from the years 2002 - 2018 the average number of fire-related casualties per year is 2. The highest number of injuries - 11 took place in 2004, and the lowest - 0 in 2009. The data has a decreasing trend.
The average number of casualties per 1,000 fire incidents is 14. This indicator was the highest - 105 in 2004, and the lowest 0 in 2009. The trend for injuries per 1,000 fires is declining. Compared to the Illinois value the number of injuries per 1,000 fire incidents is higher.
Based on the data from the years 2002 - 2018 the average number of fire-related casualties per year is 2. The highest number of injuries - 11 took place in 2004, and the lowest - 0 in 2009. The data has a decreasing trend.
The average number of casualties per 1,000 fire incidents is 14. This indicator was the highest - 105 in 2004, and the lowest 0 in 2009. The trend for injuries per 1,000 fires is declining. Compared to the Illinois value the number of injuries per 1,000 fire incidents is higher.Casualties per 1,000 incidents in Franklin Park, IL compared to nearest cities:
(Note: Based on data for all years, including only cities with at least 500 fire incidents)
| Franklin Park: | 15.4 |
| Schiller Park: | 8.6 |
| River Grove: | 3.1 |
| Northlake: | 4.7 |
| Melrose Park: | 12.3 |
| Elmwood Park: | 3.5 |
| Bellwood: | 5.1 |
| Berkeley: | 7.5 |
| Maywood: | 6.1 |
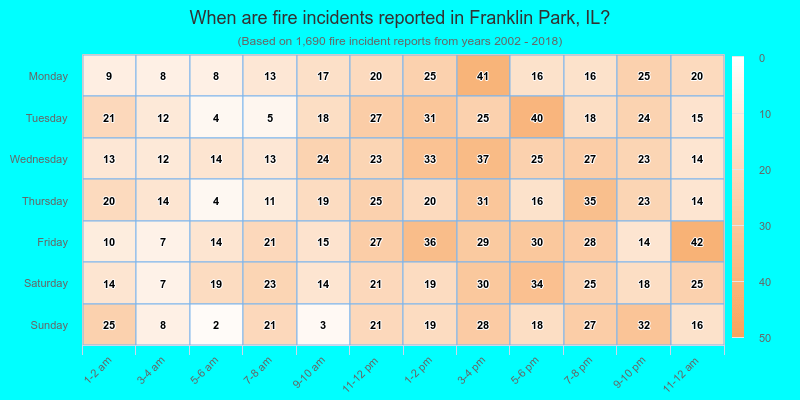
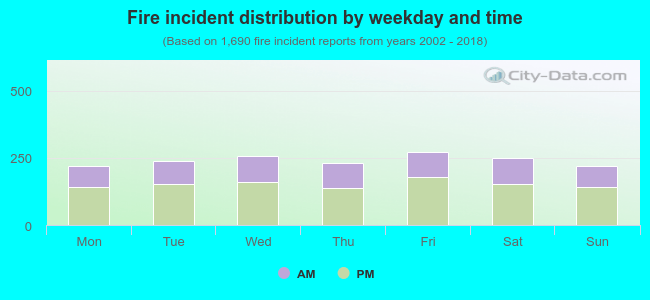 37.0% incidents where reported in the morning and 63.0% in the evening. The most fires (16.2%) took place on Friday, and the least (12.9%) on Monday.
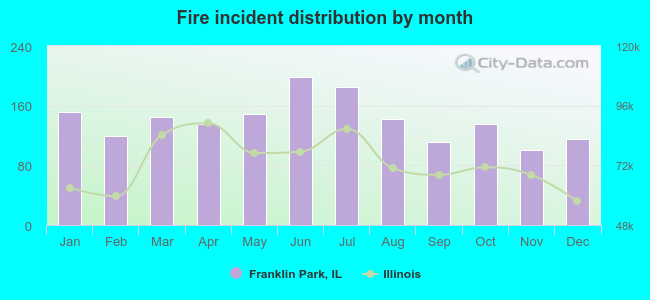 According to the 1,690 incident reports from years 2002 - 2018 most fires (11.8%) took place during June, and the least (6.0%) in November.
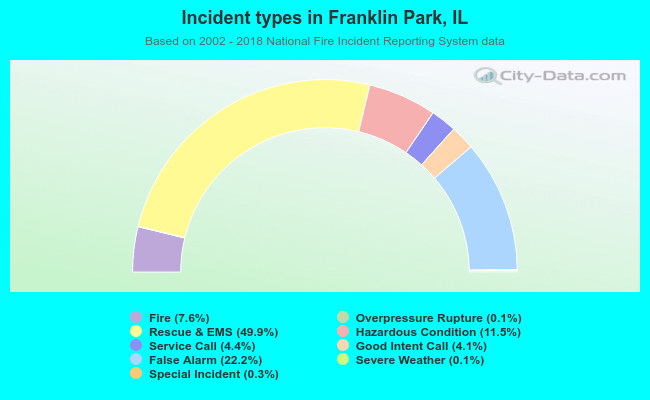 Out of all 22,296 cases reported during the years 2002 - 2018, the most belonged to the categories: Rescue & EMS (49.9%), False Alarm (22.2%), and Hazardous Condition (11.5%).
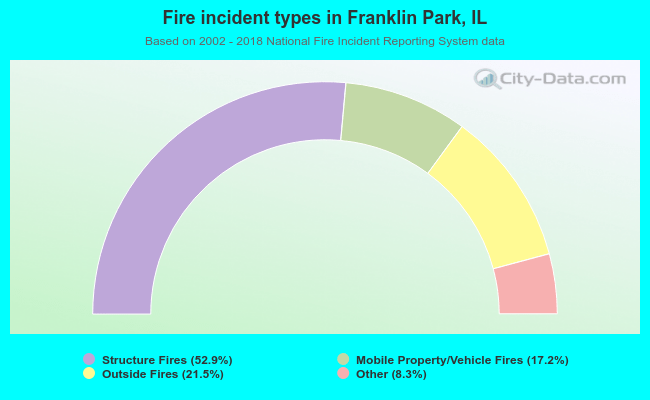 When looking into fire subcategories, the most reports belonged to: Structure Fires (52.9%), and Outside Fires (21.5%).