Fulton: Fire Incidents, Missouri (MO)
Where are fire incidents reported in Fulton, MO
Something went wrong! Please refresh the page.
| Fire incidents reported | |
|---|---|
| Sreet name | Count |
| WESTMINSTER AVE | 150 |
| BLUFF ST | 94 |
| HICKMAN AVE | 78 |
| BUSINESS 54 SOUTH | 52 |
| JEFFERSON ST | 42 |
| 8TH ST | 40 |
| 5TH ST | 34 |
| 12TH ST | 30 |
| INTERSTATE 70 EAST BOUND | 30 |
| SPRUCE DR | 30 |
| 6TH ST | 28 |
| STATE ROAD J | 28 |
| GRAND AVE | 26 |
| HIGHWAY 54 | 26 |
| INTERSTATE 70 WEST BOUND | 24 |
| COURT ST | 22 |
| VINE ST | 22 |
| 2ND ST | 20 |
| 7TH ST | 20 |
| CHESTNUT ST | 20 |
| MOKANE RD | 20 |
| STATE RD O | 20 |
| US 54 | 20 |
| WESTVIEW DR | 20 |
| INDUSTRIAL DR | 18 |
| STATE ROAD F | 18 |
| UNIVERSITY AVE | 18 |
| WESTMINSTER | 18 |
| 10TH ST | 16 |
| CARDINAL DR | 16 |
| Other | 535 |
2003 - 2018 National Fire Incident Reporting System (NFIRS) incidents
- Incident types reported to NFIRS in Fulton, MO
- 2,85533.6%Hazardous Condition
- 1,53518.1%Fire
- 1,44817.1%Service Call
- 1,25114.7%Rescue & EMS
- 7018.3%False Alarm
- 6587.7%Good Intent Call
- 180.2%Overpressure Rupture
- 140.2%Severe Weather
- 120.1%Special Incident
- Fire incident types reported to NFIRS in Fulton, MO
- 72947.5%Structure Fires
- 54635.6%Outside Fires
- 23115.0%Mobile Property/Vehicle Fires
- 291.9%Other
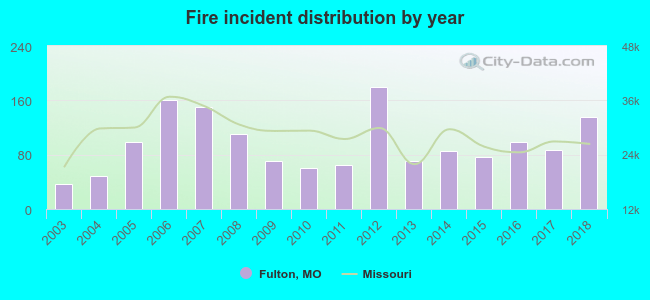 According to the data from the years 2003 - 2018 the average number of fire incidents per year is 96. The highest number of reported fires - 179 took place in 2012, and the least - 37 in 2003. The data has an increasing trend.
The average number of yearly fire incidents per 10k residents in Fulton, MO compared to nearest cities:
(Note: Based on data for the last 3 years, including only cities with population 5,000 and above)
| Fulton: | 83.2 |
| Columbia: | 34.9 |
| Mexico: | 4.9 |
| Jefferson City: | 22.0 |
| Boonville: | 95.9 |
| Warrenton: | 27.3 |
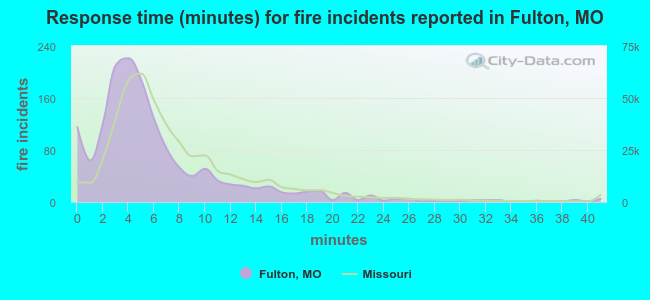 The median response time based on all reported fire incidents is 5 minutes. This is lower compared to the Missouri median value.
The median response time in Fulton, MO compared to nearest cities:
(Note: Based on data for all years, including only cities with at least 500 fire incidents)
| Fulton: | 5 minutes |
| Holts Summit: | 9 minutes |
| Columbia: | 5 minutes |
| Mexico: | 4 minutes |
| Jefferson City: | 6 minutes |
| California: | 7 minutes |
| Owensville: | 11 minutes |
| Boonville: | 5 minutes |
| Warrenton: | 11 minutes |
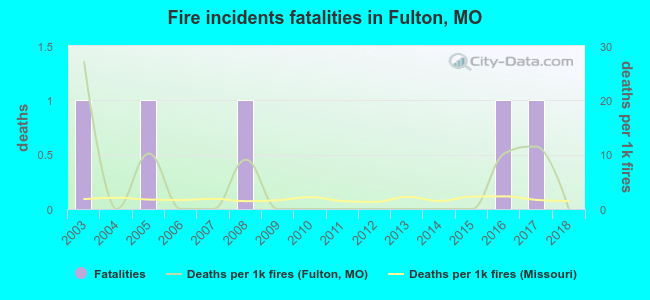 According to the reports from the years 2003 - 2018 the average number of fire-related fatalities per year is 0. The highest number of deaths - 1 took place in 2003, and the lowest - 0 in 2004. The data has a dropping trend.
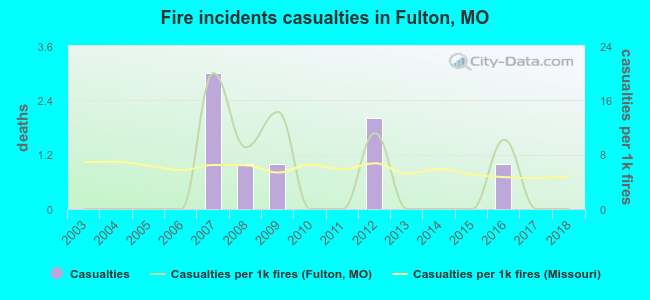 Based on the data from the years 2003 - 2018 the average number of fire-related yearly casualties is 1. The highest number of casualties - 3 took place in 2007, and the lowest - 0 in 2003. The data has a constant trend.
The average number of injuries per 1,000 fires is 4. This indicator was the highest - 20 in 2007, and the lowest 0 in 2003. The trend for casualties per 1,000 fire incidents is constant. Compared to the Missouri value the number of injuries per 1,000 incidents is about the same.
Based on the data from the years 2003 - 2018 the average number of fire-related yearly casualties is 1. The highest number of casualties - 3 took place in 2007, and the lowest - 0 in 2003. The data has a constant trend.
The average number of injuries per 1,000 fires is 4. This indicator was the highest - 20 in 2007, and the lowest 0 in 2003. The trend for casualties per 1,000 fire incidents is constant. Compared to the Missouri value the number of injuries per 1,000 incidents is about the same.Casualties per 1,000 incidents in Fulton, MO compared to nearest cities:
(Note: Based on data for all years, including only cities with at least 500 fire incidents)
| Fulton: | 5.2 |
| Holts Summit: | 0.0 |
| Columbia: | 9.8 |
| Mexico: | 15.2 |
| Jefferson City: | 3.9 |
| California: | 0.0 |
| Owensville: | 0.0 |
| Boonville: | 0.0 |
| Warrenton: | 1.0 |
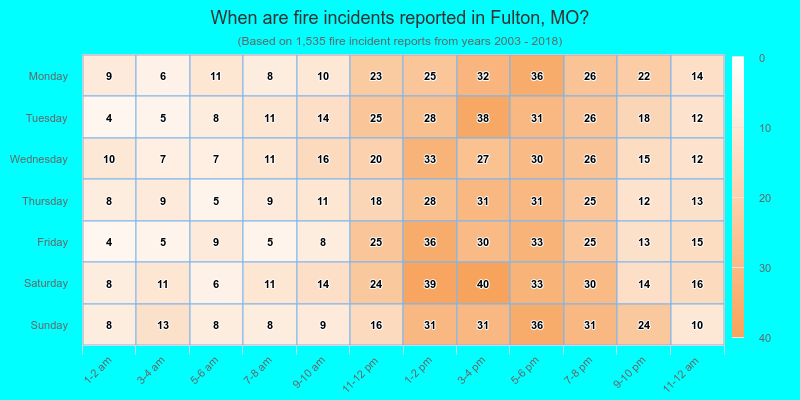
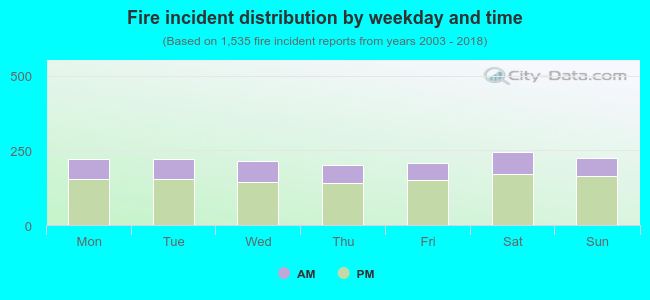 29.8% incidents where reported in the morning and 70.2% in the evening. The most fires (16.0%) took place on Saturday, and the least (13.0%) on Thursday.
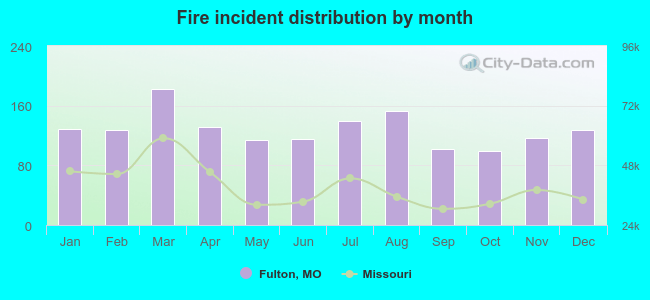 Based on the 1,535 fires from years 2003 - 2018 most fires (11.9%) took place during March, and the least (6.4%) in October.
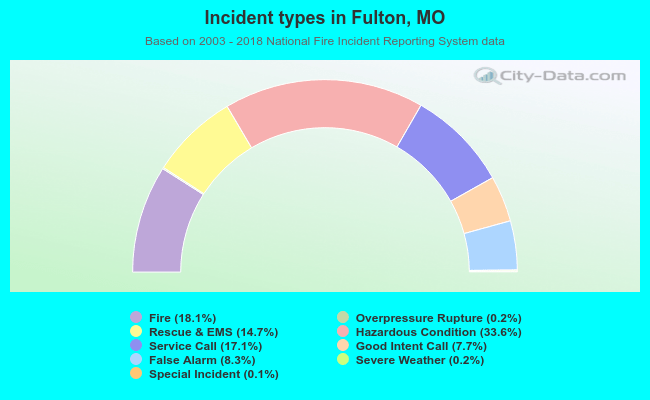 Out of all 8,492 cases reported during the years 2003 - 2018, the most belonged to the categories: Hazardous Condition (33.6%), Fire (18.1%), and Service Call (17.1%).
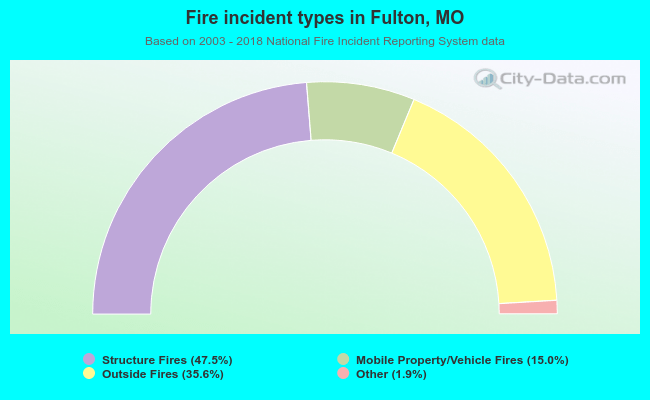 When looking into fire subcategories, the most incidents belonged to: Structure Fires (47.5%), and Outside Fires (35.6%).