Fultondale: Fire Incidents, Alabama (AL)
Where are fire incidents reported in Fultondale, AL
Something went wrong! Please refresh the page.
|
| |||||||||||||||||||||||||||||||||||||||||||||||||||||||||||||||||||||||||||||||||||||||||||||||||||||||||||||
2006 - 2018 National Fire Incident Reporting System (NFIRS) incidents
- Incident types reported to NFIRS in Fultondale, AL
- 3,69371.4%Rescue & EMS
- 59311.5%Service Call
- 3877.5%False Alarm
- 1663.2%Fire
- 1563.0%Good Intent Call
- 1102.1%Hazardous Condition
- 340.7%Severe Weather
- 320.6%Special Incident
- Fire incident types reported to NFIRS in Fultondale, AL
- 6941.6%Structure Fires
- 5331.9%Outside Fires
- 3822.9%Mobile Property/Vehicle Fires
- 63.6%Other
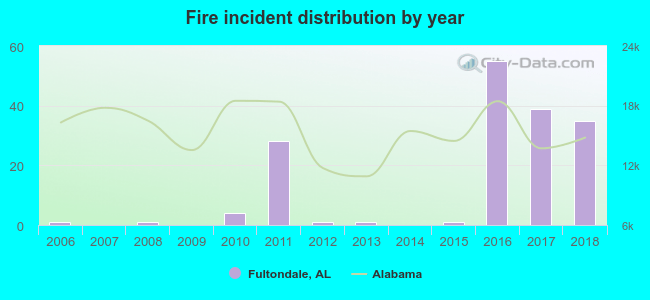 Based on the data from the years 2006 - 2018 the average number of fire incidents per year is 13. The highest number of reported fire incidents - 55 took place in 2016, and the least - 0 in 2007. The data has an increasing trend.
The average number of yearly fire incidents per 10k residents in Fultondale, AL compared to nearest cities:
(Note: Based on data for the last 3 years, including only cities with population 5,000 and above)
| Fultondale: | 48.3 |
| Tarrant: | 58.6 |
| Gardendale: | 48.3 |
| Birmingham: | 87.0 |
| Center Point: | 49.5 |
| Pinson: | 104.1 |
| Irondale: | 55.7 |
| Mountain Brook: | 11.4 |
| Homewood: | 35.3 |
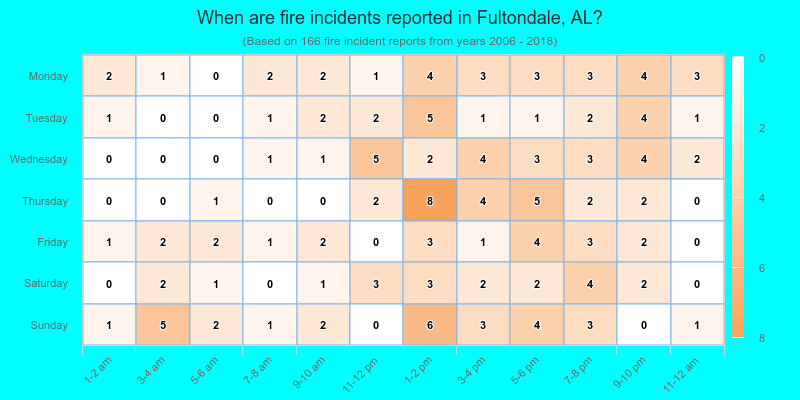
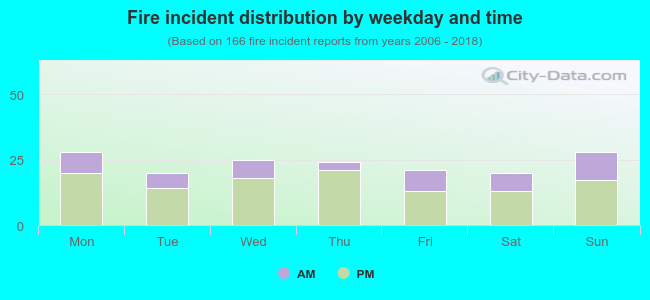 30.1% incidents where reported in the morning and 69.9% in the evening. The most fires (16.9%) took place on Monday, and the least (12.0%) on Tuesday.
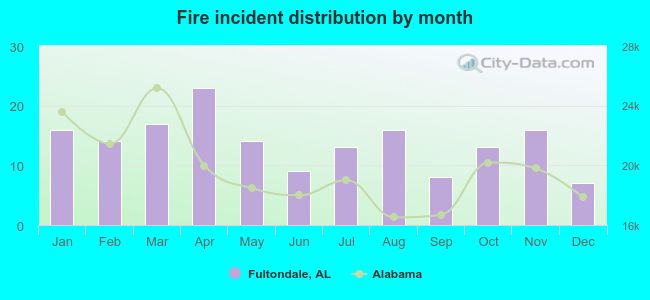 According to the 166 reports from years 2006 - 2018 most fires (13.9%) took place during April, and the least (4.2%) in December.
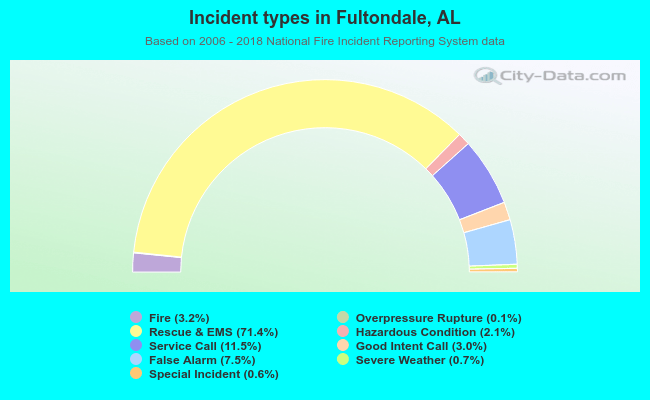 Out of all 5,175 cases reported during the years 2006 - 2018, the most belonged to the categories: Rescue & EMS (71.4%), Service Call (11.5%), and False Alarm (7.5%).
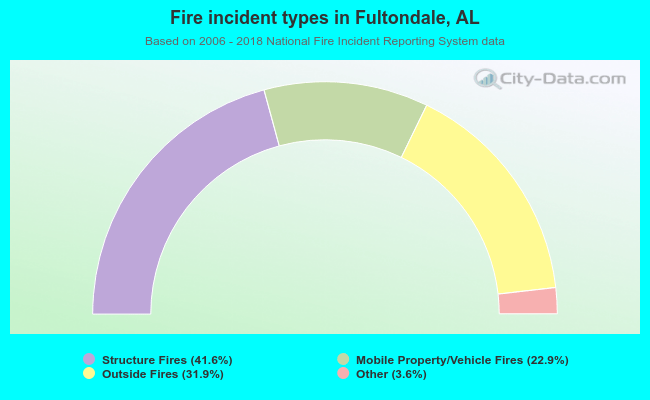 When looking into fire subcategories, the most incidents belonged to: Structure Fires (41.6%), and Outside Fires (31.9%).