Gahanna: Fire Incidents, Ohio (OH)
Where are fire incidents reported in Gahanna, OH
Something went wrong! Please refresh the page.
| Fire incidents reported | |
|---|---|
| Sreet name | Count |
| HAMILTON RD | 86 |
| JOHNSTOWN RD | 60 |
| TAYLOR RD | 54 |
| STYGLER RD | 48 |
| IMPERIAL DR | 40 |
| MORRISON RD | 40 |
| 270 | 38 |
| CHERRY BOTTOM RD | 28 |
| MORSE RD | 28 |
| GRANVILLE ST | 26 |
| PENNY LN | 26 |
| TAYLOR STATION RD | 26 |
| VISTA DR | 26 |
| HAVENS CORNERS RD | 22 |
| MILL ST | 22 |
| AGLER RD | 20 |
| ROCKY FORK BLVD | 20 |
| GREEN MEADOWS DR | 18 |
| MEADOW GREEN CIR | 18 |
| ARBORS CIR | 16 |
| CLAYCRAFT RD | 16 |
| GAHANNA PKWY | 16 |
| HAMILTON | 16 |
| STONERIDGE LN | 16 |
| VISTA DR | 16 |
| HIGH ST | 14 |
| HARRISON POND DR | 12 |
| HEMSTON CT | 12 |
| RESEARCH RD | 12 |
| SHADY SPRING DR | 12 |
| Other | 263 |
2004 - 2018 National Fire Incident Reporting System (NFIRS) incidents
- Incident types reported to NFIRS in Gahanna, OH
- 2,40231.7%Good Intent Call
- 1,26616.7%Hazardous Condition
- 1,12814.9%Rescue & EMS
- 1,06714.1%Fire
- 1,04813.8%False Alarm
- 6138.1%Service Call
- 370.5%Overpressure Rupture
- 190.3%Severe Weather
- 90.1%Special Incident
- Fire incident types reported to NFIRS in Gahanna, OH
- 54350.9%Structure Fires
- 32530.5%Outside Fires
- 19618.4%Mobile Property/Vehicle Fires
- 30.3%Other
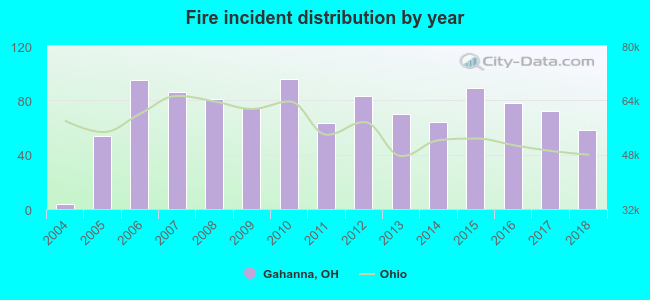 According to the data from the years 2004 - 2018 the average number of fire incidents per year is 71. The highest number of fire incidents - 96 took place in 2010, and the least - 4 in 2004. The data has a rising trend.
The average number of yearly fire incidents per 10k residents in Gahanna, OH compared to nearest cities:
(Note: Based on data for the last 3 years, including only cities with population 5,000 and above)
| Gahanna: | 20.2 |
| New Albany: | 42.0 |
| Whitehall: | 50.3 |
| Bexley: | 9.6 |
| Reynoldsburg: | 28.7 |
| Columbus: | 38.2 |
| Westerville: | 14.8 |
| Worthington: | 24.6 |
| Pataskala: | 73.5 |
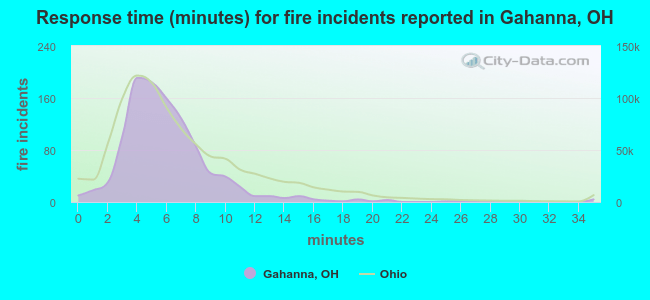 The median response time based on all reported fire incidents is 5 minutes. This is lower than the Ohio median value.
The median response time in Gahanna, OH compared to nearest cities:
(Note: Based on data for all years, including only cities with at least 500 fire incidents)
| Gahanna: | 5 minutes |
| Whitehall: | 4 minutes |
| Reynoldsburg: | 6 minutes |
| Columbus: | 4 minutes |
| Westerville: | 6 minutes |
| Worthington: | 4 minutes |
| Pataskala: | 7 minutes |
| Upper Arlington: | 5 minutes |
| Pickerington: | 6 minutes |
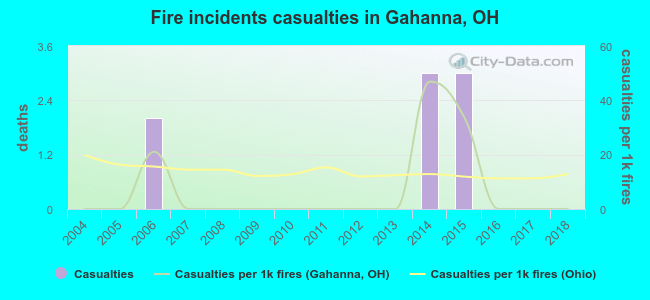 According to the data from the years 2004 - 2018 the average number of fire-related casualties per year is 1. The highest number of injuries - 3 took place in 2014, and the lowest - 0 in 2004. The data has a constant trend.
The average number of injuries per 1,000 fires is 7. This indicator was the highest - 47 in 2014, and the lowest 0 in 2004. The trend for injuries per 1,000 fires is constant. Compared to the state value the number of injuries per 1,000 fires is lower.
According to the data from the years 2004 - 2018 the average number of fire-related casualties per year is 1. The highest number of injuries - 3 took place in 2014, and the lowest - 0 in 2004. The data has a constant trend.
The average number of injuries per 1,000 fires is 7. This indicator was the highest - 47 in 2014, and the lowest 0 in 2004. The trend for injuries per 1,000 fires is constant. Compared to the state value the number of injuries per 1,000 fires is lower.Casualties per 1,000 incidents in Gahanna, OH compared to nearest cities:
(Note: Based on data for all years, including only cities with at least 500 fire incidents)
| Gahanna: | 7.5 |
| Whitehall: | 9.9 |
| Reynoldsburg: | 22.3 |
| Columbus: | 13.4 |
| Westerville: | 15.6 |
| Worthington: | 10.2 |
| Pataskala: | 22.3 |
| Upper Arlington: | 15.7 |
| Pickerington: | 15.8 |
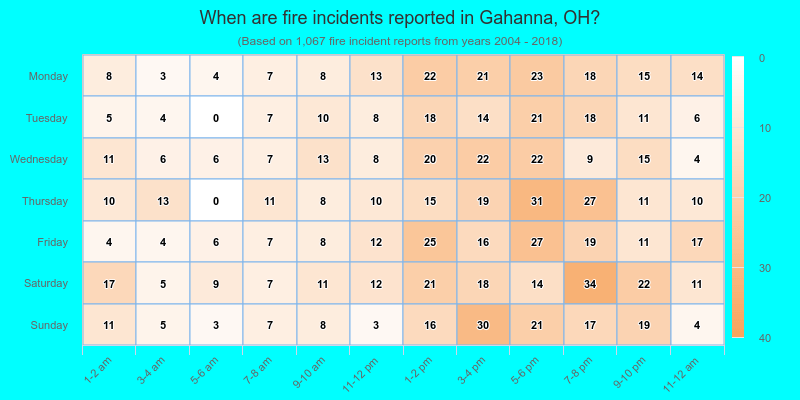
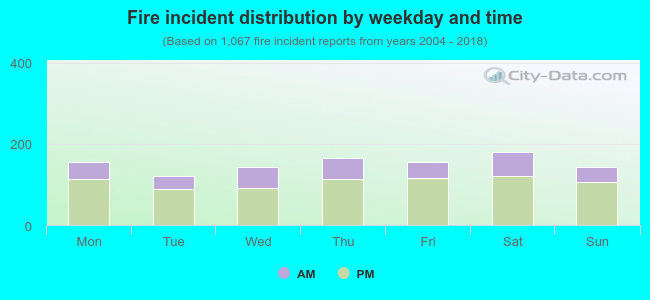 29.9% incidents where reported in the morning and 70.1% in the evening. The most fires (17.0%) took place on Saturday, and the least (11.4%) on Tuesday.
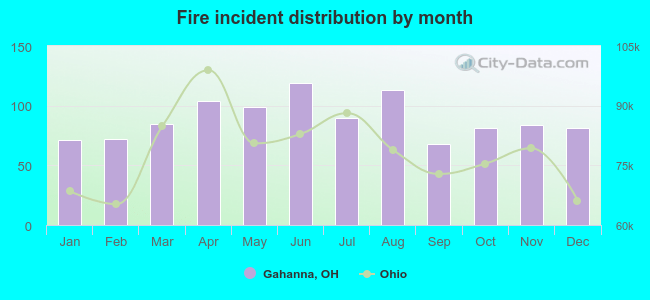 According to the 1,067 fire incidents from years 2004 - 2018 most fires (11.2%) took place during June, and the least (6.4%) in September.
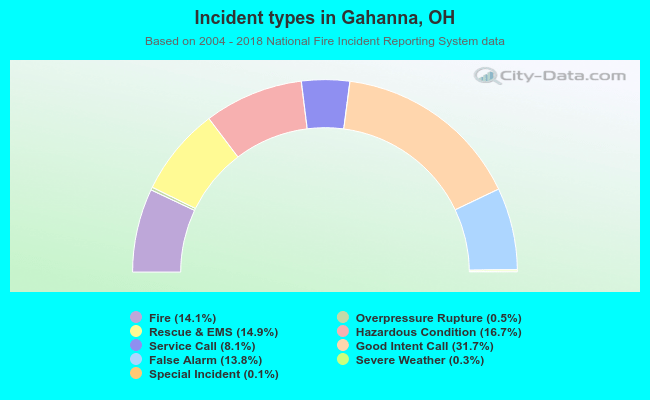 Out of all 7,589 cases reported during the years 2004 - 2018, the most belonged to the categories: Good Intent Call (31.7%), Hazardous Condition (16.7%), and Rescue & EMS (14.9%).
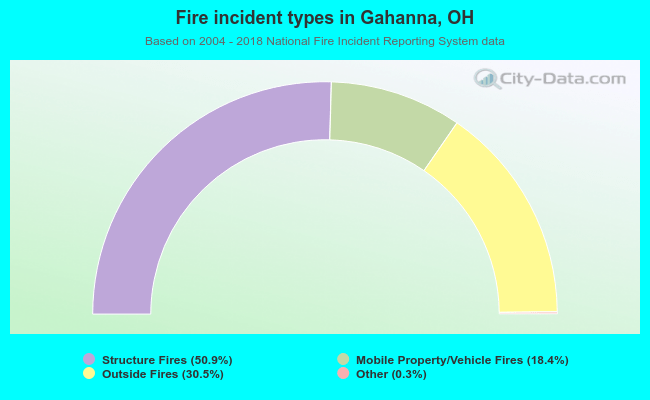 When looking into fire subcategories, the most reports belonged to: Structure Fires (50.9%), and Outside Fires (30.5%).