Galt: Fire Incidents, California (CA)
Where are fire incidents reported in Galt, CA
Something went wrong! Please refresh the page.
|
| |||||||||||||||||||||||||||||||||||||||||||||||||||||||||||||||||||||||||||||||||||||||||||||||||||||||||||||
2005 - 2018 National Fire Incident Reporting System (NFIRS) incidents
- Incident types reported to NFIRS in Galt, CA
- 1,45564.2%Rescue & EMS
- 32914.5%Fire
- 1496.6%Good Intent Call
- 1356.0%Service Call
- 984.3%Hazardous Condition
- 984.3%False Alarm
- Fire incident types reported to NFIRS in Galt, CA
- 18957.4%Outside Fires
- 6620.1%Structure Fires
- 5617.0%Mobile Property/Vehicle Fires
- 185.5%Other
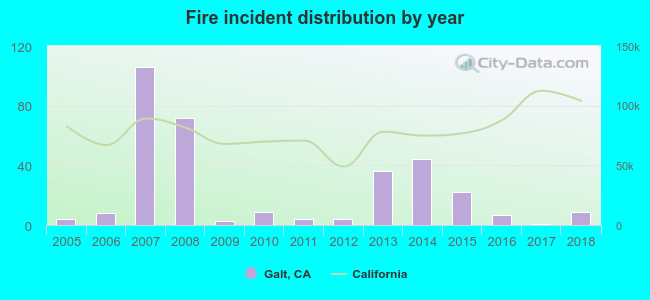 Based on the data from the years 2005 - 2018 the average number of fires per year is 24. The highest number of fire incidents - 106 took place in 2007, and the least - 1 in 2017. The data has an increasing trend.
The average number of yearly fire incidents per 10k residents in Galt, CA compared to nearest cities:
(Note: Based on data for the last 3 years, including only cities with population 5,000 and above)
| Galt: | 2.3 |
| Lodi: | 46.5 |
| Wilton: | 19.6 |
| Franklin: | 3.3 |
| Thornton: | 22.6 |
| Elk Grove: | 2.5 |
| Laguna: | 0.5 |
| Florin: | 51.8 |
| Sloughhouse: | 25.9 |
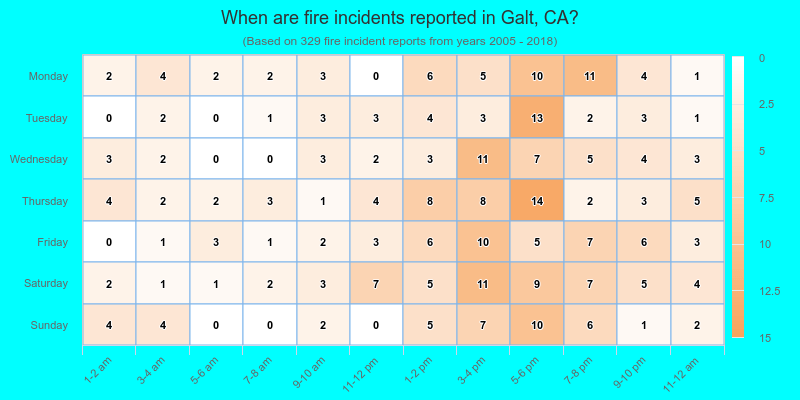
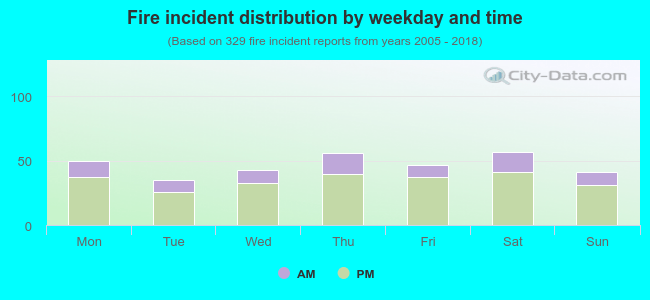 25.5% incidents where reported in the morning and 74.5% in the evening. The most fires (17.3%) took place on Saturday, and the least (10.6%) on Tuesday.
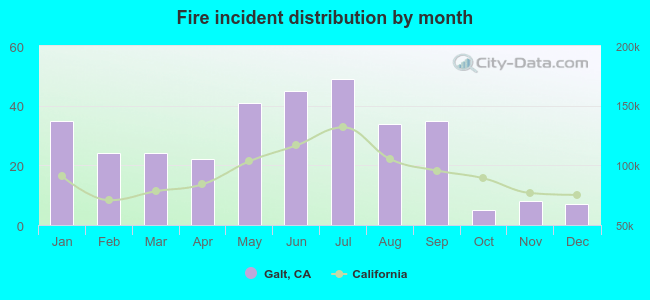 According to the 329 fire incidents from years 2005 - 2018 most fires (14.9%) took place during July, and the least (1.5%) in October.
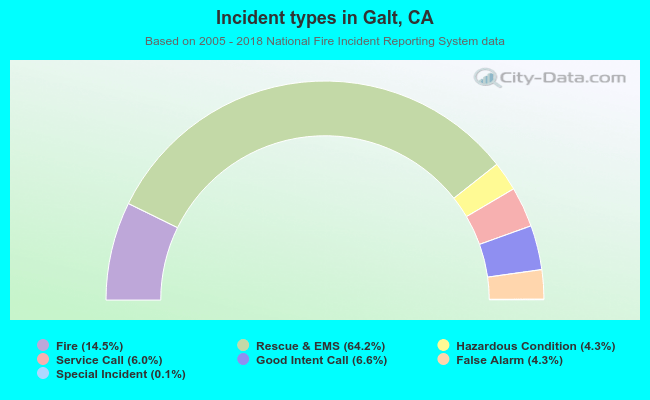 Out of all 2,266 cases reported during the years 2005 - 2018, the most belonged to the categories: Overpressure Rupture (64.2%), Fire (14.5%), and Service Call (6.6%).
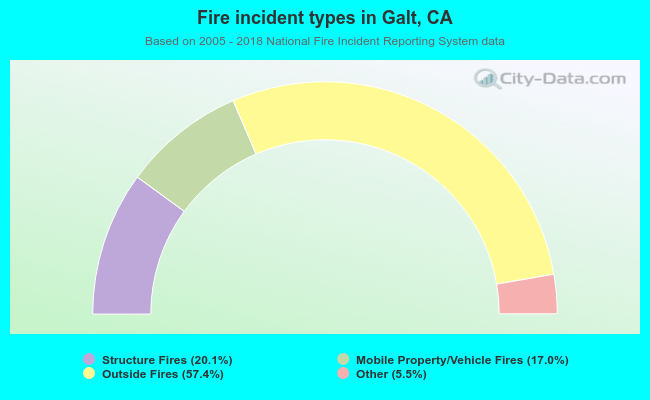 When looking into fire subcategories, the most incidents belonged to: Outside Fires (57.4%), and Structure Fires (20.1%).