| Fire incidents reported |
|---|
| Sreet name | Count |
|---|
| INTERSTATE 94 | 10 | | CO RD 40 | 8 | | LAKE IDA WAY | 6 | | PLEASENT GROVE | 6 | | 39TH AVE NW | 4 | | 8301 CO RD 82 NW | 4 | | BIG CHIP TRAIL | 4 | | CO RD 22 | 4 | | CO RD 8 | 4 | | CO RD 82 | 4 | | COUNTY RD 12 | 4 | | COUNTY RD 56 | 4 | | I 94 | 4 | | INTERSTATE -94 | 4 | | LAKE SIDE DR | 4 | | LOBSTER DR | 4 | | MOE HALL RD | 4 | | SANSTEAD ST | 4 | | 10183 CO RD 12 | 2 | | 10823MOE HALL RD NW | 2 | | 10TH AVE SW | 2 | | 1634 GOLDEN DR NW | 2 | | 203 SANSTEAD ST | 2 | | 210 E IDA ST | 2 | | 27 HWY | 2 |
| | | Fire incidents reported |
|---|
| Sreet name | Count |
|---|
| 3129 LUIS DR NW | 2 | | 3720 CO 40 | 2 | | 39TH AVE | 2 | | 39TH AVE | 2 | | 4141 PLEASANT GROVE NW | 2 | | 6536 CO RD 82 NW | 2 | | 6800 N LAKE MINA RD | 2 | | 6956 PLEASENT GROVE NW | 2 | | 7334 CO 6 | 2 | | 8301 CORD82NW | 2 | | 8375 SETHNEY LN SW | 2 | | 8563 LOBSTER | 2 | | 8563 NE LOBSTER DRIVE SW | 2 | | 8601 CR 12 NW | 2 | | 8871 BREEZY CIRCLE NW | 2 | | 9867 CO RD 27 W | 2 | | BEAUTY POINT RD | 2 | | BEDMANS DR | 2 | | BEDMEN DR | 2 | | BIG CHIP LAKE | 2 | | BLUE JAY WAY | 2 | | BLUE JAY WAY NW | 2 | | BRANDON | 2 | | BREEZY CIRCLE | 2 | | |
|
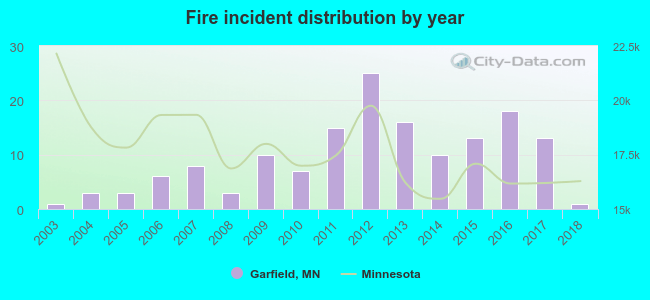 Based on the data from the years 2003 - 2018 the average number of fires per year is 10. The highest number of reported fires - 25 took place in 2012, and the least - 1 in 2003. The data has a constant trend.
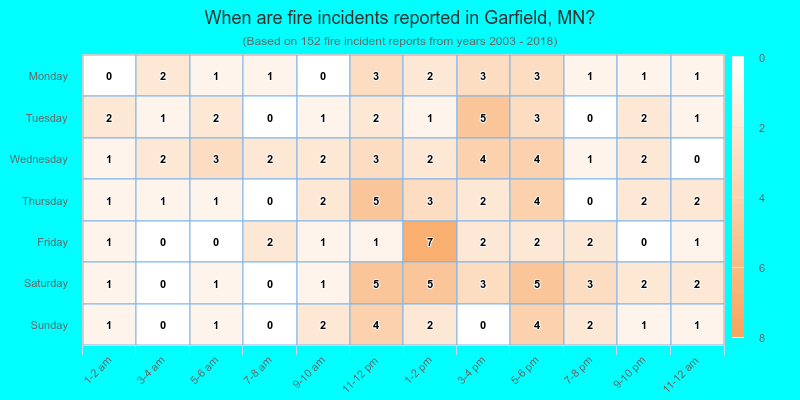
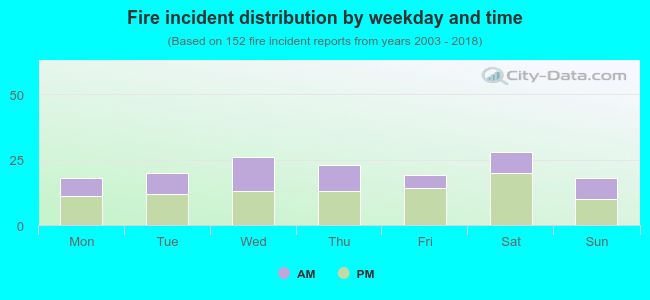 38.8% incidents where reported in the morning and 61.2% in the evening. The most fires (18.4%) took place on Saturday, and the least (11.8%) on Monday.
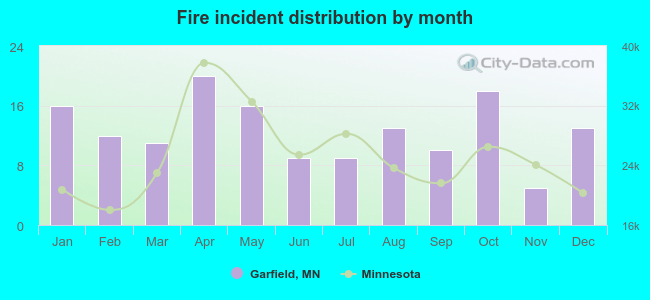 According to the 152 fires from years 2003 - 2018 most fires (13.2%) took place during April, and the least (3.3%) in November.
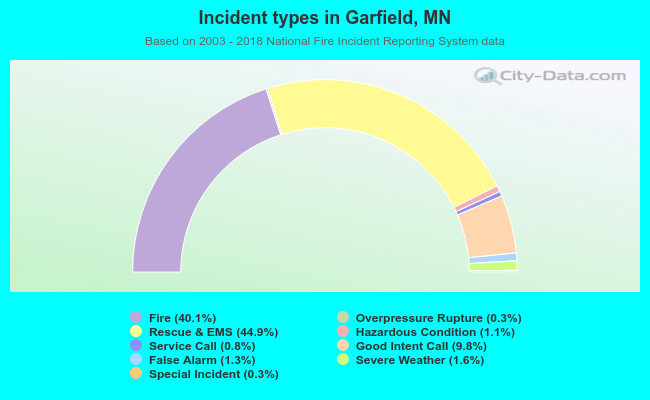 Out of all 379 cases reported during the years 2003 - 2018, the most belonged to the categories: Rescue & EMS (44.9%), Fire (40.1%), and Good Intent Call (9.8%).
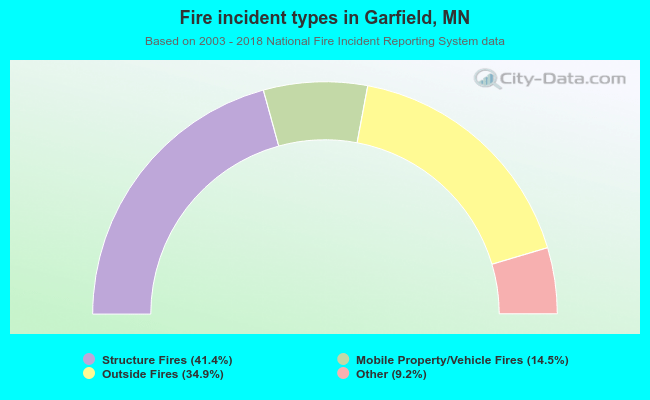 When looking into fire subcategories, the most incidents belonged to: Structure Fires (41.4%), and Outside Fires (34.9%).